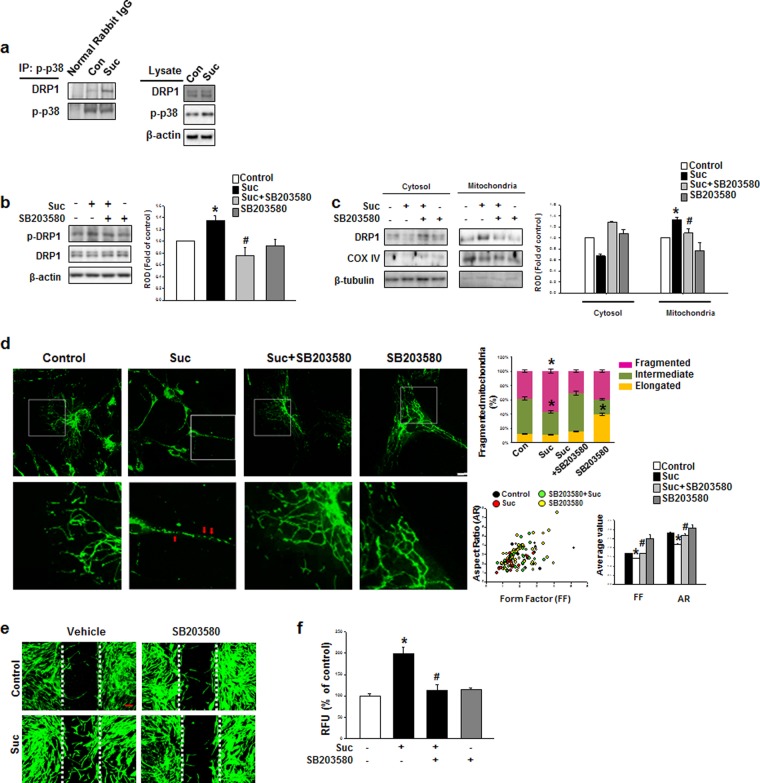
Figure 4.
Succinate-induced p38 MAPK activation regulates DRP1 phosphorylation. (a) Cells were treated with succinate for 12 hr and the total lysate were used for performing immunoprecipitation using normal rabbit IgG or p-p38 antibody to determine the protein binding. (b) hMSCs were with/without SB203580 (1 μM) for 30 min, and then exposed to succinate for 12 hr. The cell lysates were analyzed with western blotting, and detected with phospho-DRP1 antibody. Data denote the mean ± SEM. n = 3, *p < 0.05 versus control, #p < 0.05 versus succinate alone. (c) Cells were pretreated with SB203580 (1 μM) for 30 min before succinate treatment for 12 hr and lysate was performed for mitochondrial fractionation. Data represent the mean ± SEM. n = 3, *p < 0.05 versus control, #p < 0.05 versus succinate alone. (d) hMSCs were pre-treated with SB203580 (1 μM) for 30 min and then exposed to succinate and then loaded with MitoTracker Green (200 nM) for 30 min. Representative images were obtained by confocal microscopy. The individual mitochondrial length was assessed, classified into three different categories and quantified as percentage. Data denote the mean ± SEM. n = 10. Scale bar = 50 μm, magnification; ×200, *p < 0.05 versus control. (e) Cells were pretreated with SB203580 (1 μM) for 30 min prior to succinate exposure for 24 hr. After incubation, wound healing assay performed with phalloidin staining to identified migrating cell. Scale bar = 50 μm, magnification; ×80. (f) Migrated cells were quantified with Oris migration assay. Data represent the mean ± SEM. n = 3, *p < 0.05 versus control, #p < 0.05 versus succinate alone. Abbreviations: RFU, relative fluorescence units; ROD, relative optical density.

