Figure 2.
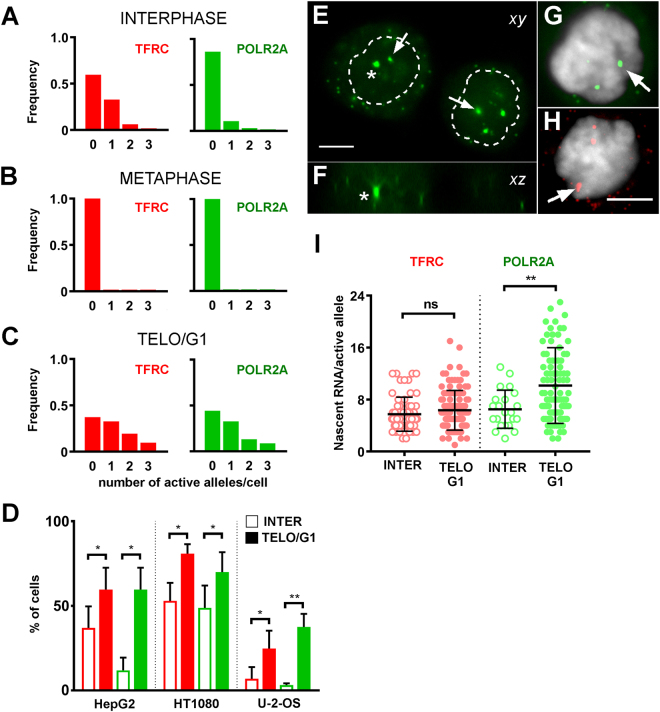
Transcription is increased upon mitotic exit. (A–C) Frequency distribution of the number of active alleles per HepG2 cell for TFRC (red) and POLR2A (green), at interphase (A, total of 131 cells), metaphase (B, total of 33 cells) or telophase/early G1 (C, total of 113 cells), n = 3 experiments. (D) Proportion of cells showing at least one active allele in interphase (open bars) or telophase/early G1 (filled bars). The data is shown for 3 different cell lines. Mean ± standard deviation of n = 3 experiments. *p < 0.05. **p < 0.01. (E–H) Representative images of smRNA FISH signals in a pair of daughter cells shortly after mitotic exit (E,F, POLR2A, green) or in individual nuclei (G, POLR2A, green; (H, TFRC, red). Shown are xy (E,G,H) projections of 2 consecutive optical sections (thickness of 0.5 μm). The xz projection (F) passes through one of the intense nuclear dots of the nucleus on the left in panel D (asterisks). Arrows point to some of the intense nuclear dots which mark putative transcription sites. Notice that the nuclear dots are clearly bigger than neighboring cytoplasmic dots and are often found in regions that weakly stain with DAPI. DAPI counterstain in gray. Contours of nuclei dotted. Scale bar, 5 µm. (I) Number of nascent RNA molecules per active allele in interphase cells (open circles) or in telophase/early G1 (filled circles). TFRC (red): interphase, total of 64 alleles; telophase/early G1, total of 117 alleles. POLR2A (green): interphase, total of 22 alleles; telophase/early G1, total of 100 alleles. n = 3 experiments. Mean values (thick lines) ± standard deviation. ns, not significant. **p < 0.01.

