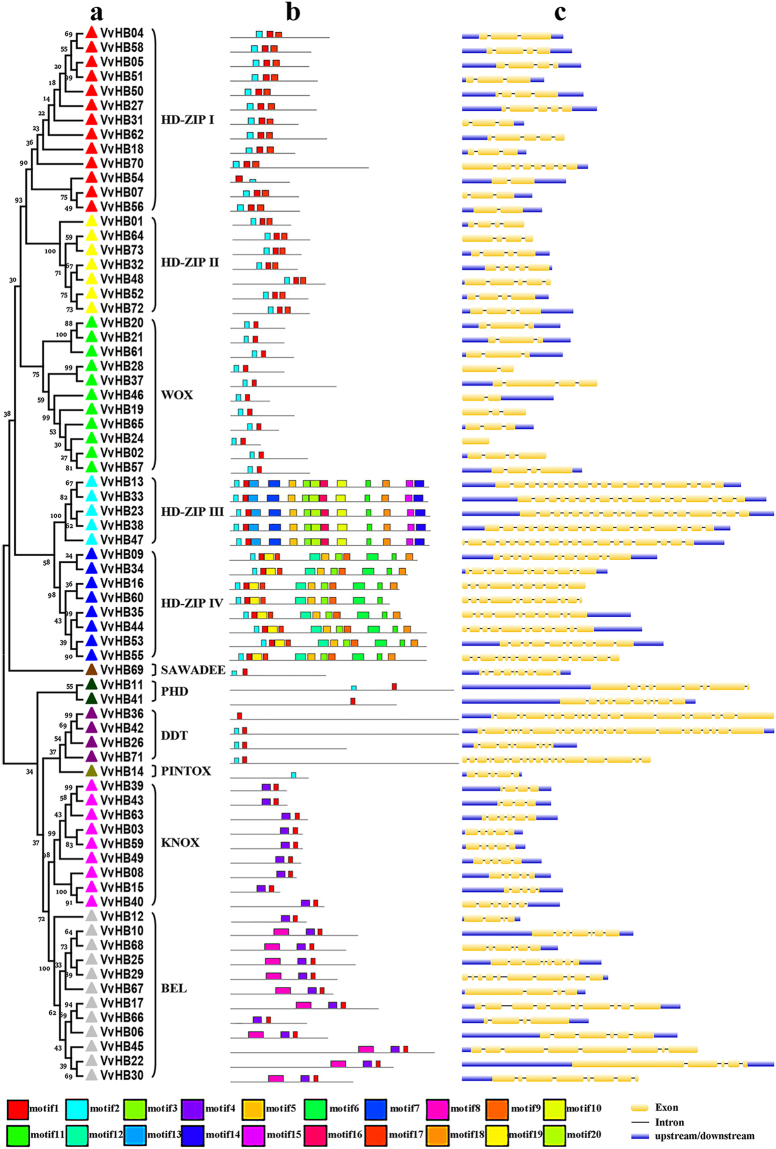
Figure 2.
The structure analysis of grape HB genes. (a) Phylogenetic analysis and classification of grape genes. The phylogenetic tree was constructed with alignments of HD sequences from each gene using MEGA 5.0 software. Subtree branch lines are colored indicating different subfamilies. Numbers near the tree branches indicate bootstrap values. (b) Motif analysis of grape proteins. Motifs, numbered 1-20, were identified using MEME 4.11.2 software and are distinguished by color. Peptide sequence of each motif is provided in Supplementary Table S2. (c) Exon-intron structures of grape HB genes. Exons are marked as yellow boxes, and introns are represented by black lines connecting two exons. Upstream/downstream sequences are shown as blue boxes. Only exons and upstream/downstream sequences are drawn to scale.

