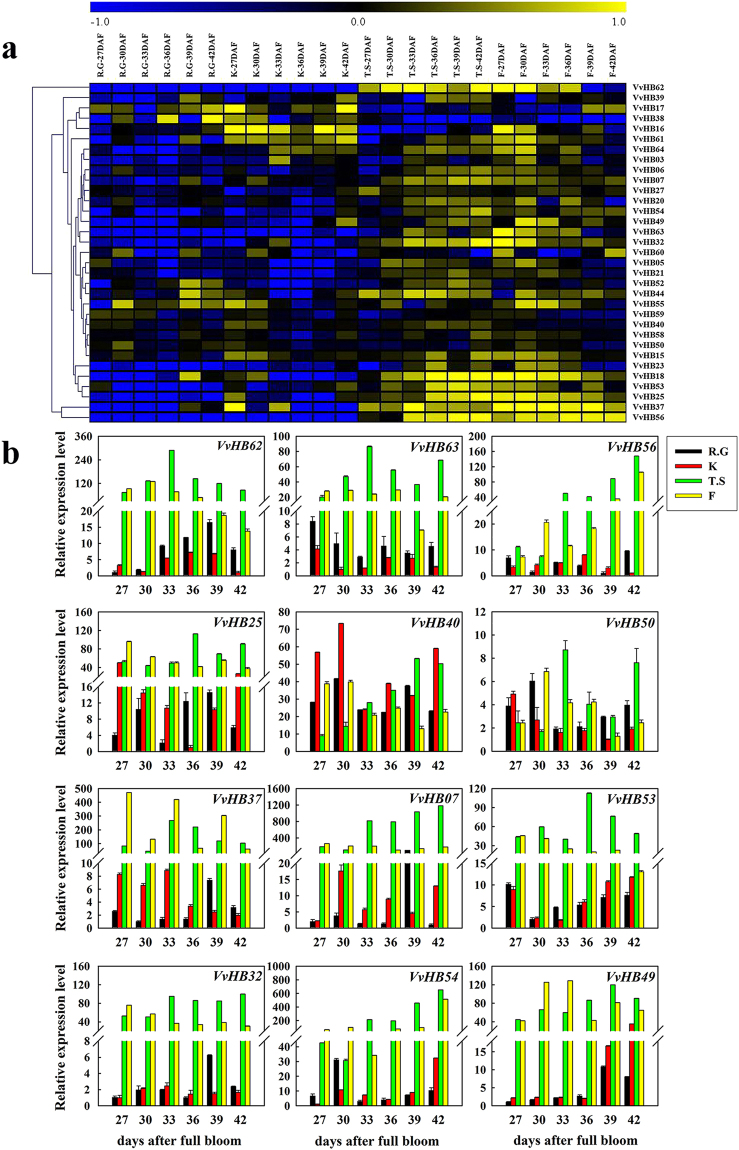
Figure 7.
Expression profiles of grape HB genes during ovule development in four grape cultivars. Two seedless grape cultivars, ‘Thompson Seedless’ and ‘Flame Seedless’, are denoted as ‘T.S’ and ‘F’ respectively. Two seeded grape cultivars, ‘Red Globe’ and ‘Kyoho’, are denoted as ‘R.G’ and ‘K’ respectively. (a) Semi-quantitative RT-PCR analysis. For each gene, yellow and blue color scale indicates high and low expression levels, respectively. Numbers indicate the number of days after full bloom (DAF). Transcripts were normalized to the expression of the ACTIN1 gene and EF1-α gene and the results are shown in Supplementary Figs S4 and S5. Semi-quantitative RT-PCR measurements were analyzed using GeneTools software, and data was normalized based on the mean expression value of each gene in all development stages. The heat map was analyzed using MeV 4.8 software. (b) Real-time PCR validation of twelve genes (9 differentially expressed genes and 3 randomly selected genes) expressed during ovule development in four grape cultivars. Transcripts were normalized to the expression of the ACTIN1 gene; the mean ± SD of three biological replicates is presented.

