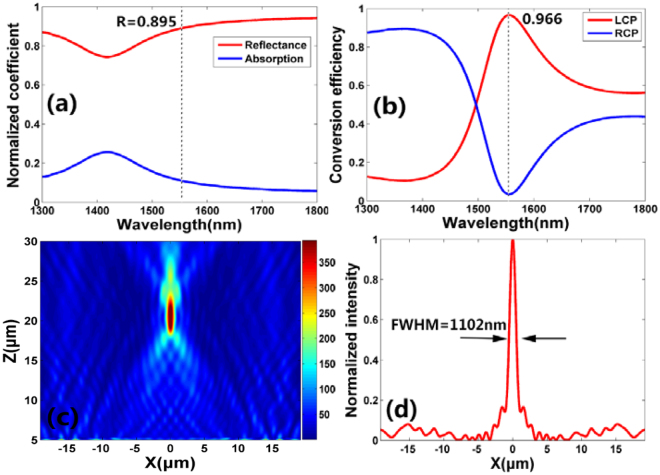
Figure 4.
(a) Simulated reflection and absorption coefficient of the unit cell as a function of the incident wavelength. (b) Simulated polarization conversion efficiency of the unit cell as a function of the incident wavelength. The red and blue lines represent the proportion of the LCP and RCP in the total reflected power, respectively. (c) Simulated intensity (|E|2) profile of the reflected light in x-z plane at y = 0 with RCP incident light. (d) Vertical cut of focal spot for the metalens.

