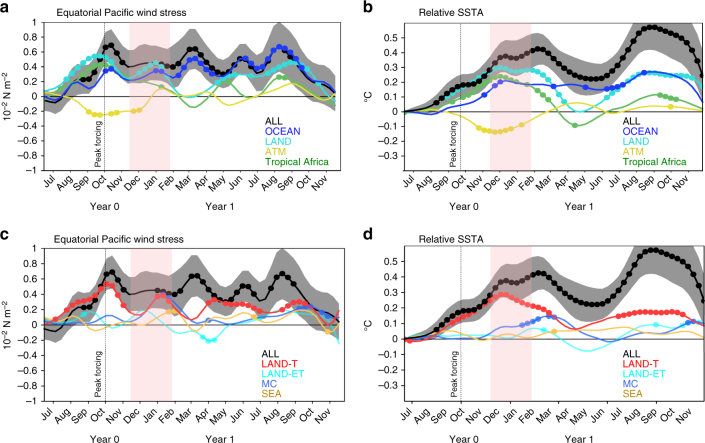
Fig. 5.
Western equatorial Pacific wind stress and relative sea surface temperature (SST) anomalies following the Pinatubo eruption. a Time series of averaged western and central Pacific (5 °N–5 °S, 130 °E to 120 °W) wind stress anomalies (in 10−2 N m−2) from ALL, ATM, OCEAN, LAND and tropical Africa atmospheric experiments and b the corresponding responses of the Niño3.4 (5 °N–5 °S, 170 °W–120 °W) relative SST (in °C) anomalies in the linear continuously stratified model simulations. c, d Same as a, b from the IPSL-CM5B atmospheric component ALL, LAND, LAND-ET, LAND-T, MC and SEA sensitivity experiments. The dots indicate months, for which at least two thirds of the individual members display consistent sign anomalies. The shading indicates the 90% confidence interval for the ALL experiment only. The vertical dotted line and peak forcing label in each panel locates the time of the peak surface shortwave anomalies in the tropics (20 °S–20 °N) induced by the volcanic eruption

