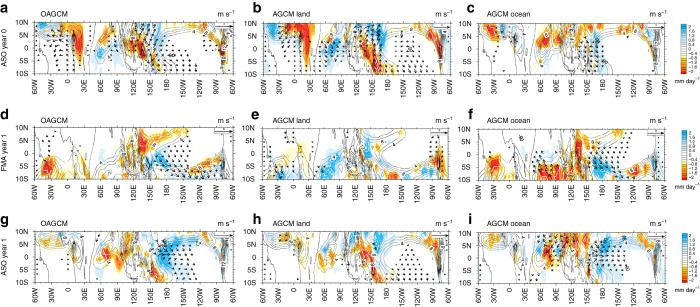
Fig. 6.
Tropical precipitation and wind patterns in response to the volcanic forcing. August–September–October of year 0 (top row), February–March–April of year 1 (middle row) and August–September–October of year 1 (bottom row) tropical (10 °S–10 °N) precipitation (mm day−1, colour shading) and surface wind (m s−1, vectors) ensemble mean anomalies resulting from Pinatubo forcing in a, d, g the IPSL-CM5B coupled model ensemble starting from neutral conditions, and the b, e, h LAND and c, f, i OCEAN experiments (see Methods). Anomalies are only shown when significantly different from zero at the 90% confidence level, according to a two-tailed Welch’s t-test. The thin black contours correspond to climatological precipitation (in mm day−1) and reveal the seasonal phase locking of Kelvin waves eastward propagation along the latitude of the climatological Intertropical Convergence Zone (ITCZ) and Africa monsoon

