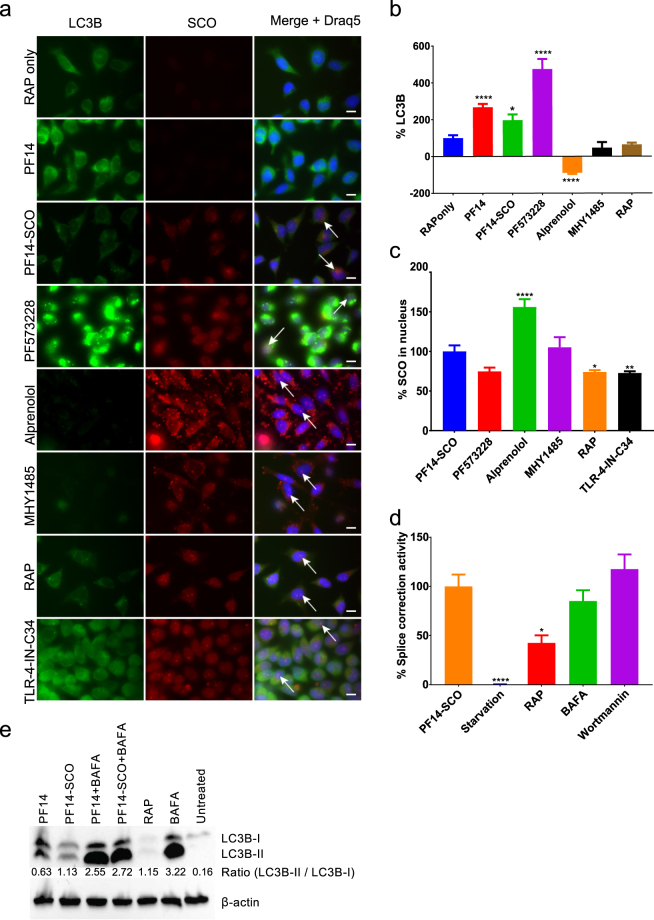
Figure 5.
Induction of autophagy by PF14 and its complexes with SCO. (a) Epifluorescence micrographs of HeLa pLuc/705 cells treated for 24 h with Rapamycin (RAP) 500 nM, or 2 μM PF14, or PF14 and splice correction oligo labelled with Alexa 568 nano-complexes (PF14/SCOAlexa568) (red, formed at molar ratio 10/1) with or without 6 µM focal adhesion kinase inhibitor (PF573228), 10 µM Alprenolol hydrochloride (β-adrenoceptor antagonist), 10 nM mTOR activator (MHY1485), 500 nM RAP, 76 nM TLR-4-IN-C34 (TLR4 inhibitor). Immunofluorescence of LC3B as autophagy marker protein is shown (green), arrows point to SCO colocalized with the nucleus. (b) Quantification of green immunofluorescence signal of LC3B is with the same treatments as in (a). Data were normalized to the baseline green signal of untreated cells, and the 100% as a signal from treatment with RAP alone without PF14/SCO complexes. (c) Quantification of the red signal from PF14/SCO(Alexa568) complexes in the nucleus in the treatments of (a) which have the complexes, data was normalized to the baseline red signal of untreated cells, and the 100% is PF14/SCO(Alexa568) complexes. (d) HeLa pLuc/705 cells treated with PF14/SCO complexes with or without starvation for 4 h with EPSS medium, 500 nM RAP, 500 nM Bafilomycin A (BAFA), 500 nM Wortmannin for 24 h in full DMEM medium. Splice correction activity is based on luminescence signal from splice corrected luciferase. Splice correction activity was normalized to the baseline signal of untreated cells, and the 100% is PF14/SCO complexes treatment. (e) Western blot of LC3B for HeLa pLuc/705 cells lysates, the cells were untreated or treated with 500 nM RAP, PF14, PF14/SCO nano-complexes with or without 500 nM BAFA. LC3BII/LC3BI protein ratios were calculated from band intensities normalized to β-actin bands intensities. Scale bar is 10 µm (*P < 0.0351,**P < 0.0033, ****P < 0.0001).

