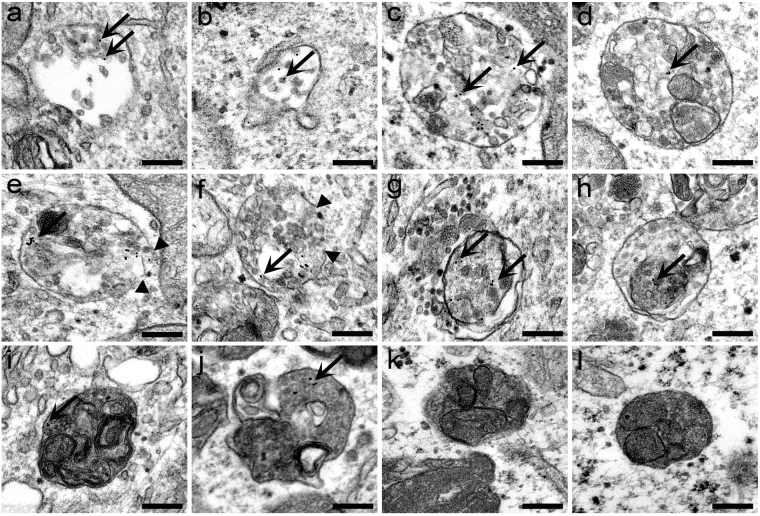
Figure 6.
Analysis of the cellular uptake of PF14/pDNA complexes and induction of autophagy using transmission electron microscopy. HeLa cells were incubated with PF14/pDNA nano-complexes (0.1 μg/ml CR 2) tagged with 10 nm colloidal gold particle (black dots) for 1 h (a,b) 4 h (c–f), 8 h (g,h) or 24 h (i,j). Localization of PF14/pDNA complexes (pointed by arrows) in early (a,b) and late endosomal organelles (c–f); in autophagosomes (g,h) and autolysosomes (i,j). The control cells were treated with 0.5 μM rapamycin for 24 h to promote the formation of autophagosomes and autolysosomes (k,l). Arrows point to PF14/pDNA nano-complexes in the particular organelles, and arrowheads show the fragmentary regions in the limiting membrane of endosomes. Scale bar is 200 nm.

