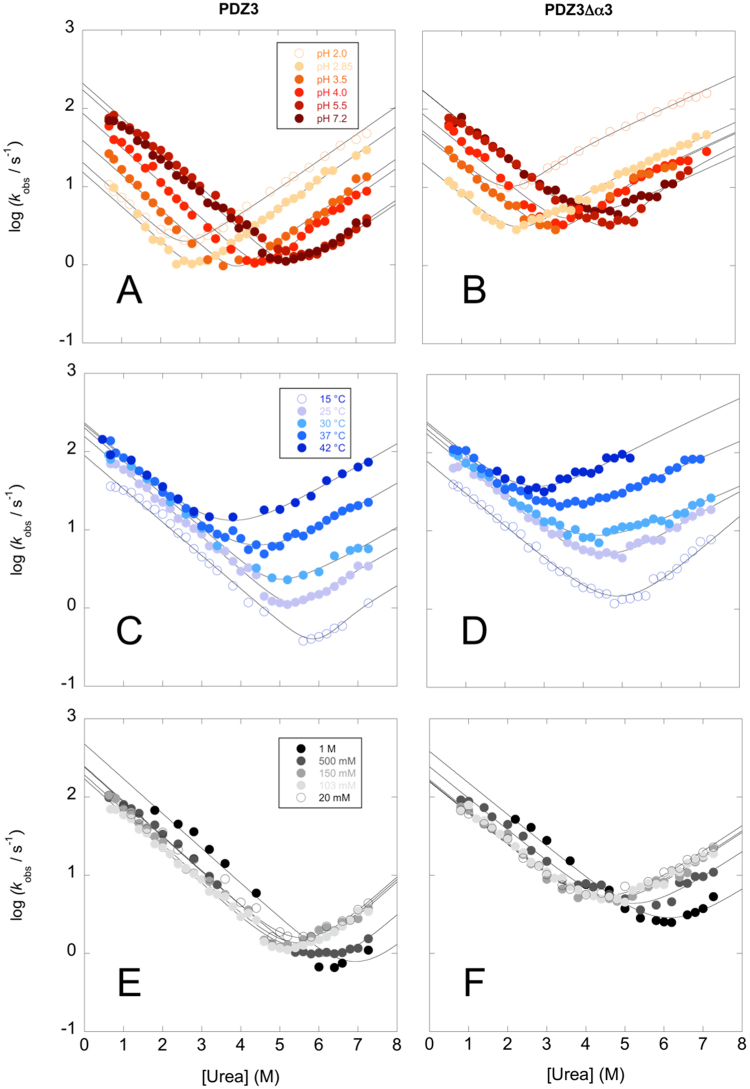
Figure 3.
Folding kinetics of PDZ3 (left) and PDZ3Δα3 (right) at different experimental conditions. Panel A and B: Chevron plots of the logarithm of unfolding and folding rate constants measured at different pH ranging from 2.0 to 7.2 at 25 °C. The lines are the best fit to a three-state model (Equation 1) with shared folding and unfolding m-values. Panel C and D: Chevron plots of the logarithm of unfolding and folding rate constants measured at different temperatures ranging from 15 to 42 °C and in 50 mM sodium-phosphate buffer at pH 7.2. Panel E and F: Chevron plots of the logarithm of the unfolding and folding rate constants measured in sodium-phosphate buffer at pH 7.2 with different ionic strengths ranging from 20 mM to 1 M and at 25 °C. The lines in panel C, D, E and F are the best fit to a two-state chevron.

