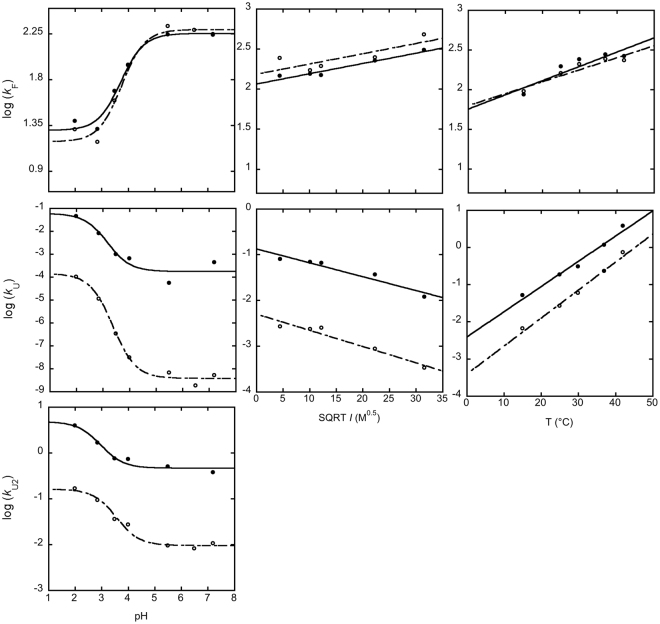
Figure 4.
Comparison of folding and unfolding rate constants calculated in the absence of denaturant of PDZ3 (empty circles) and PDZ3Δα3 (filled circles) at different experimental conditions. The rate constants were obtained by analysis of the chevron plots reported in Fig. 3. The folding rate constant k F is very similar for both PDZ3 and PDZ3Δα3 at all the experimental conditions explored. Data recorded at different pH conditions, left column, where fitted to the Henderson–Hasselbalch equation, returning a single transition with a robust apparent pK a of about 3.5. In all cases, an increase in the microscopic unfolding rate constant could be observed, consistent with a destabilization of the native state. The overall dependence of the unfolding rate constants were however unaffected by the truncation of α3.

