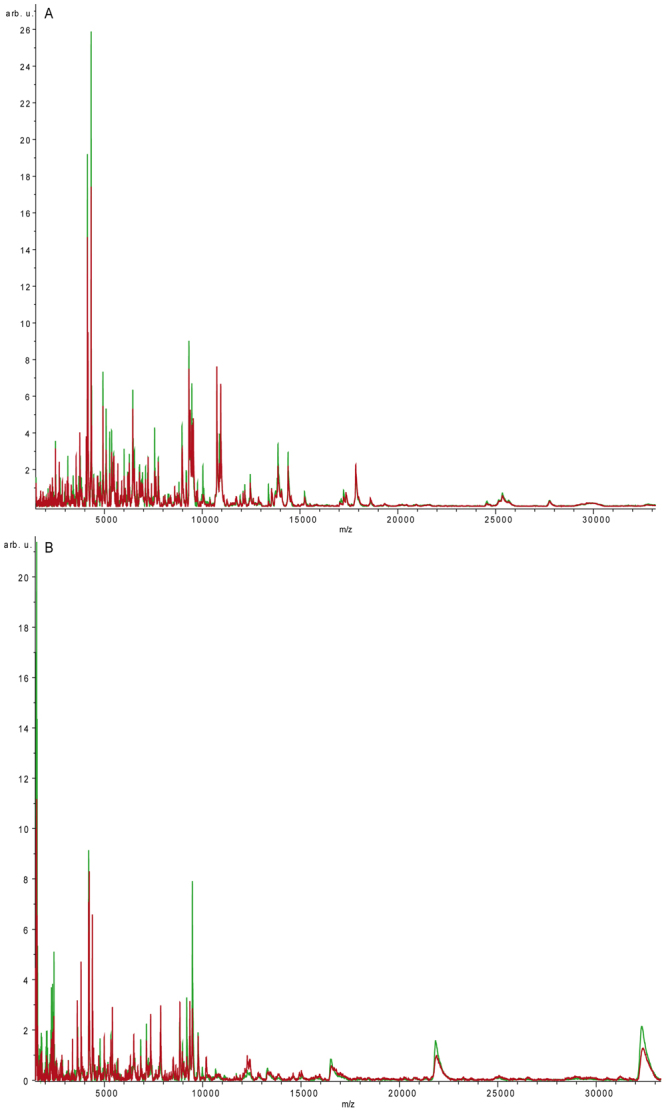
Figure 2.

(A) MALDI-profiling analysis after Human7 depletion. MALDI profiling spectrum of Hu7 depleted serum (m/z range 1500–35000) from obese (average spectrum, red line) and non-obese subjects (average spectrum, green line). After immunodepletion, samples were spotted onto the AnchorChip target using DHAP matrix as described in method section. (B) MALDI profiling analysis after Human14 depletion. MALDI profiling spectrum of Hu14 depleted serum (m/z range 1500–35000) from obese (average spectrum, red line) and non-obese subjects (average spectrum, green line). After immunodepletion, samples were spotted onto the AnchorChip target using DHAP matrix as described in method section.
