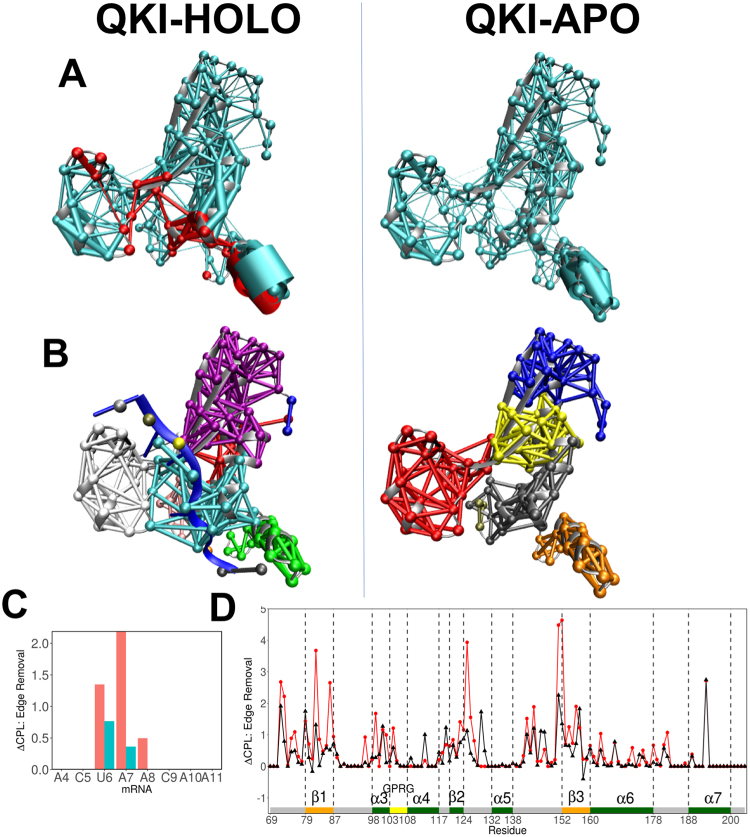
Figure 6.
(A) Networks, weighed by correlation data, within KH-QUA2 domain of QKI protein is shown for mRNA-bound HOLO state and mRNA free APO state. Red colored nodes and edges correspond to interactions within 8 Å of mRNA. (B) Splitting of the networks into different communities are shown. (C) Change in CPL upon edge removal of nucleotide is shown for mRNA. Red and blue colored bars correspond to two nodes representing nucleotide base and sugar-phosphate backbone, respectively. (D) Change in CPL upon edge removal shown for KH-QUA2 domain for mRNA bound HOLO state (black colored) and mRNA free APO state (red colored). Structural elements are depicted as in Fig. 2B.

