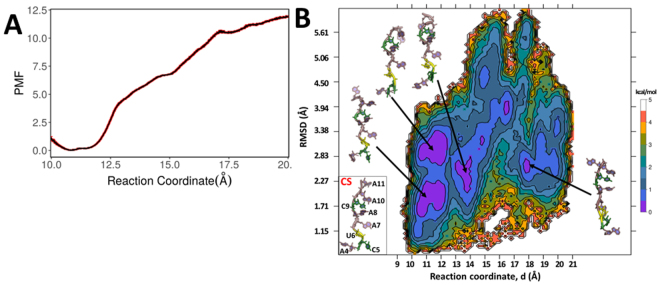
Figure 8.
(A) 1-D Potential of mean force (PMF) profile along the biased reaction coordinate as obtained from 15 umbrella sampling simulations within range of 10.5–20 Å. Errors in the PMF profile are shown in red. (B) Two-dimensional free energy profile along the biased reaction coordinate, d and rmsd values determined from umbrella sampling simulations. The representative structures are shown for each minima observed by violet-colored islands. Crystal structure of bound mRNA is shown for comparison.

