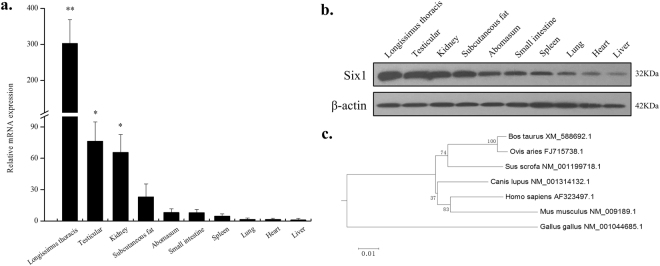
Figure 1.
(a) Expression pattern analysis of bovine SIX1 in tissues and organs. SIX1 mRNA expression was normalized against that of the housekeeping gene β-actin and expressed relative to gene expression in the liver. The value of each column represents the mean ± standard deviation based on three independent experiments. Unpaired Student’s t-test was used to detect significant differences. “*”P < 0.05 and “**”P < 0.01. (b) Bovine SIX1 expression pattern at different tissues and organs. (c) Phylogenetic tree analysis of SIX1. We calculated 8000 bootstrap replicates to bootstrap confidence values.

