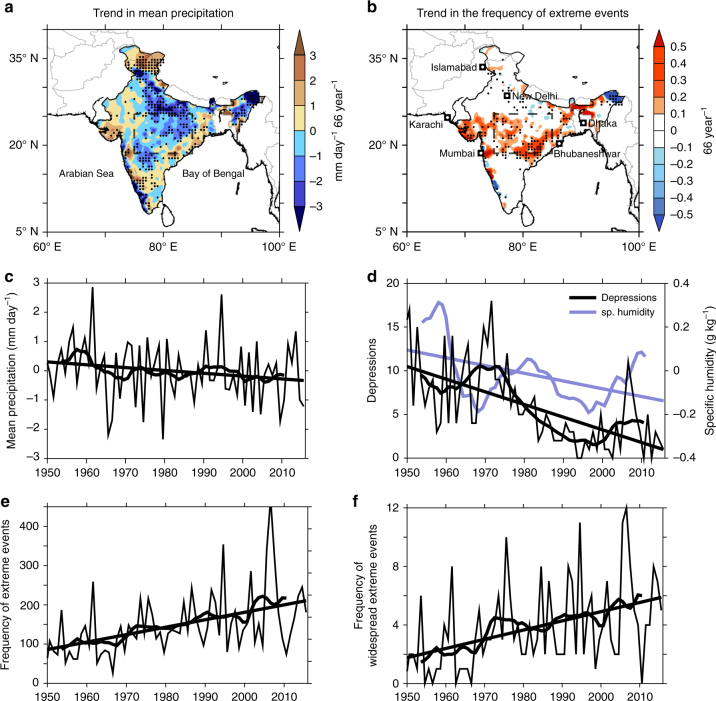
Fig. 1.
Trends in summer mean and extreme precipitation during 1950–2015. Observed trend in summer a mean precipitation anomalies (mm day−1 66 year−1) and b the frequency (66 year−1) of extreme precipitation events (precipitation ≥ 150 mm day−1). Mean precipitation for the season is 8.1 mm day−1. Time series of c of precipitation (mm day−1), d specific humidity (1000–200 hPa) anomalies (g kg−1), and the number of days with low-pressure systems over central India and e frequency of extreme rain events (number of grid cells exceeding 150 mm day−1 per year) over central Indian subcontinent (75°–85° E, 19°–26° N, inset boxes in a, d). f Time series of the frequency of widespread extreme events (number of days when the extreme events simultaneously cover ten grid cells or more). Stippling indicates trend values significant at 95% confidence level. The trend lines shown in the figures are significant at 95% confidence level. The smoothed curves on the time series analyses represent 10-year moving averages. The entire analysis is for the northern summer (June-September), for the years 1950–2015. The precipitation and cyclone data is based on IMD observations, and the specific humidity is based on NCEP reanalysis. See the “Methods” section for more information regarding the data

