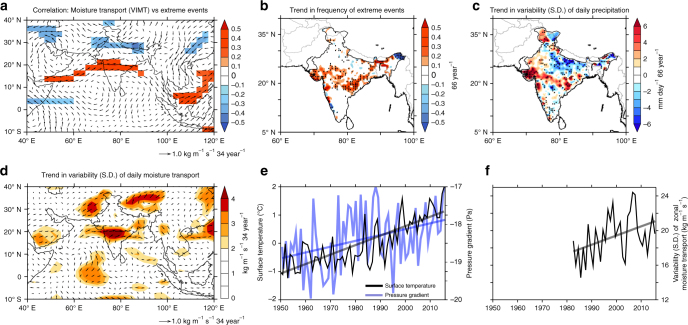
Fig. 3.
Variability in moisture transport vs widespread extreme precipitation events. a Correlation between the number of extreme precipitation events over central Indian subcontinent (75°–85° E, 19°–26° N, inset boxes in Fig. 1) and vertically integrated (1000–200 hPa) moisture transport (vectors), for the years 1950–2015. The color shades indicate the correlation with the zonal component of the moisture transport at each grid point. b Trend in the frequency of extreme precipitation events (66 year−1), for the years 1950–2015. Trend in the standard deviations (S.D.) of c daily precipitation (mm day−1 66 year−1) and d daily vertically integrated moisture transport (kg m−1 s−1 34 year−1, vectors) during 1982–2015. The color shades indicate the trend in the S.D. of zonal component of the moisture transport at each grid point (kg m−1 s−1 34 year−1). e Time series of the surface temperatures averaged over north of Arabian Sea (50°–65° E, 15°–35° N, °C, black line), and cross-equatorial pressure gradient (Pa, blue line)60, which is estimated as the difference of mean sea level pressure (MSLP) between (20°–35° N, 40–80° E) and (35°–10° S, 40°–80° E). f Time series of standard deviations of daily zonal moisture transport (moist westerlies, kg m−1 s−1). Color shades in a, d and stippling in b, c indicates correlation/trends significant at 95% confidence level. The trend lines shown in the figures are significant at 95% confidence level. Analysis of daily data is restricted to the satellite era. The precipitation data is based on IMD observations, the moisture transport and MSLP is obtained from NCEP reanalysis, and the surface temperatures from CRU/HadISST. See the “Methods” section for more information regarding the data

