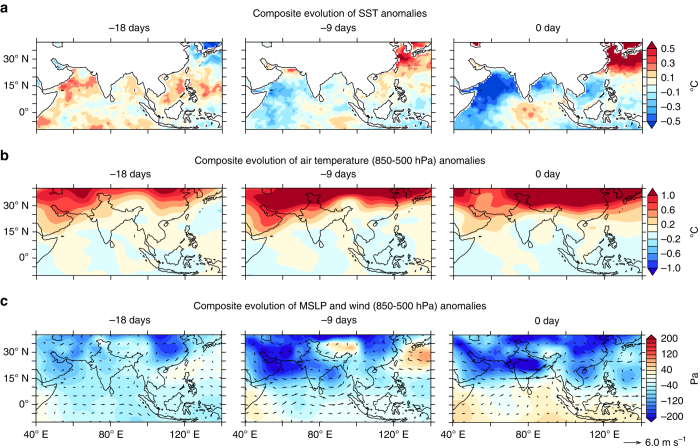
Fig. 5.
Evolution of temperature, pressure and winds leading to widespread extreme precipitation events. Composite evolution of a sea surface temperature (SST) and b air temperature (850–500 hPa) anomalies (colors, °C), c mean sea level pressure (MSLP, colors, Pa) and wind (vectors, m s−1), leading to widespread extreme precipitation events over central India (on 0-day). Daily data from OISST and NCEP reanalysis, for the period 1982–2015 is used for the composite analysis

