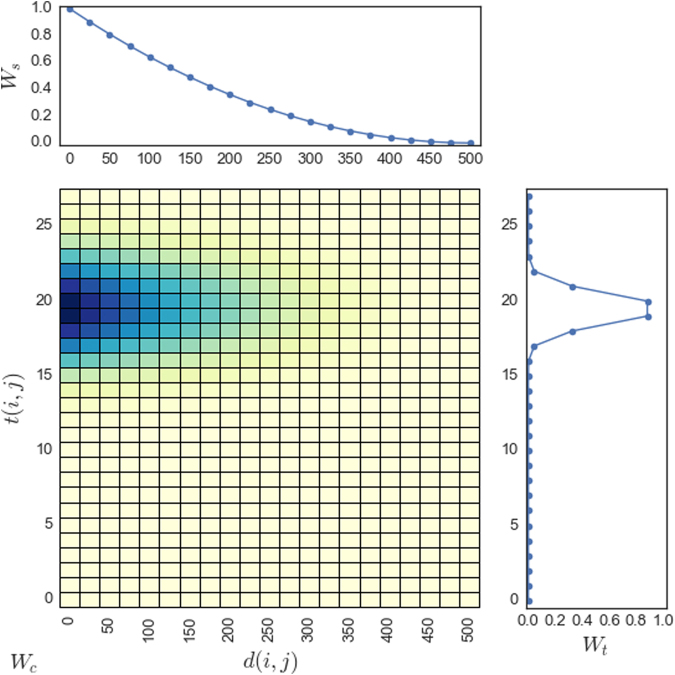
Figure 4.
The illustration of the spatial (W s), temporal (W t), and combined (W c) weighting schemes. The top figure shows the spatial weight decrease with the increasing distance (calculated using Equation 2, D is set to 500); the figure on the right shows the temporal weight having a bell curve with the center around 19–20 (calculated using Equation 3, parameters are set to T1 = 12, T2 = 27); the bottom left figure shows the combined weight distribution using the colors, the darker the higher W c (calculated using Equation 1).

