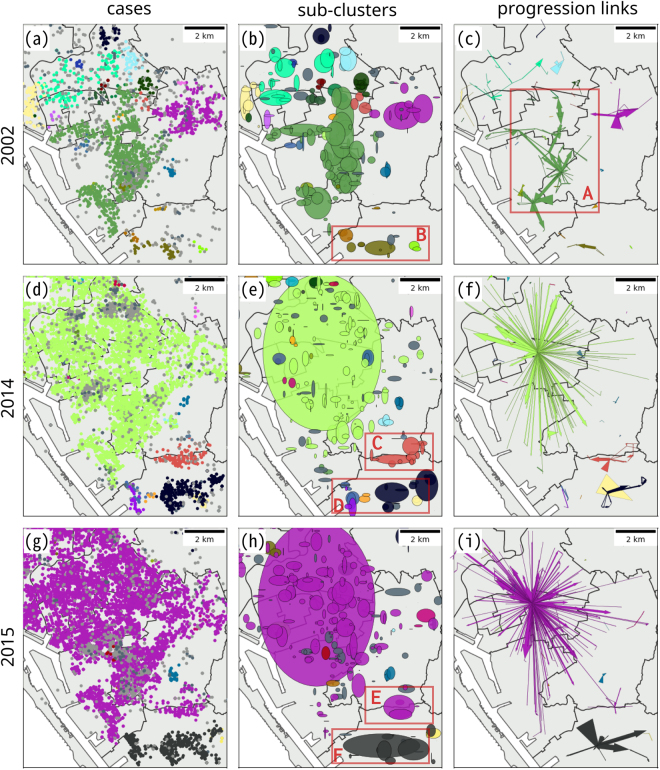
Figure 6.
Spatial distribution of cases (left), sub-clusters (middle), and progression links (right) in 2002 (first row), 2014 (second row), and 2015 (third row). The colors differentiate the progression chains. The sub-clusters were determined by the standard ellipses’ standard distances (long and short axes) and the orientation. The number of shifting links that form the progression links were used to determine the width of the progression links. The maps were created using Matplotlib (2.0.0) package in Anaconda (4.0.0, Python 2.7.11 version, url: https://www.continuum.io/anaconda-overview).

