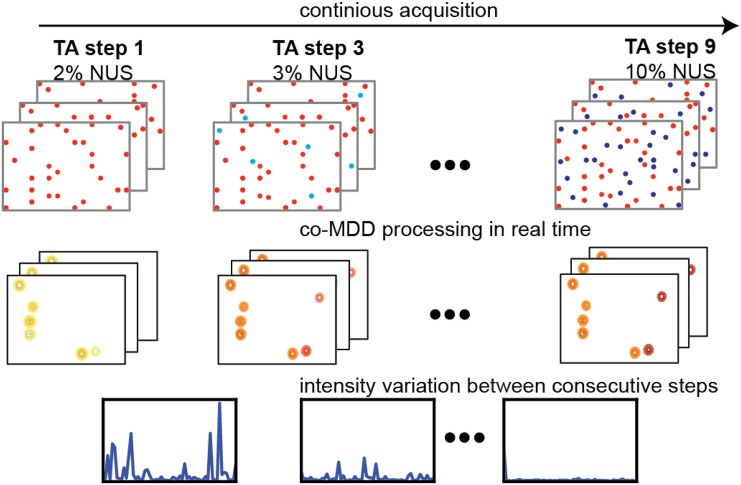
Fig. 1.
Schematic presentation of the TA procedure for the real-time estimate of the peak intensity precision. The spectra are processed in steps as more and more NUS points are acquired. The precision of individual peak intensities is estimated as the difference between the intensities obtained at two successive steps

