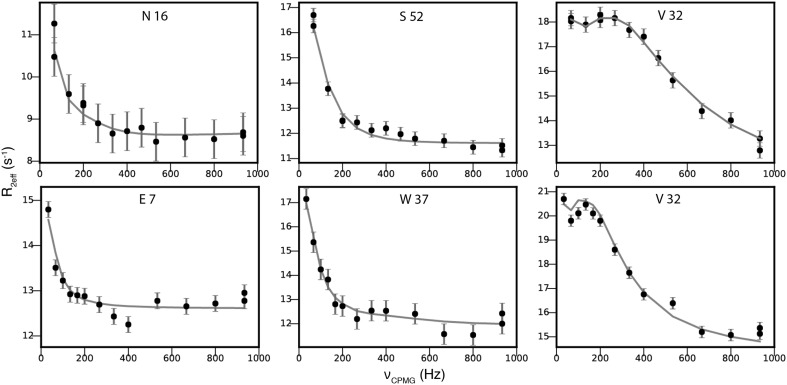
Fig. 4.
15N (top row) and 13CO (bottom row) relaxation dispersion profiles from the 3D NUS experiments for serval residues of Abp1p SH3 domain partially bound to a peptide from Ark1p. The residues with the smallest (N16/E7), median (S52/W37) and largest (V32) |Δϖ| are shown. Filled circles represent experimental data collected using the three-dimensional pulse sequence with sparse sampling at 18.8 T. The line represents the best fit to a global two-state model

