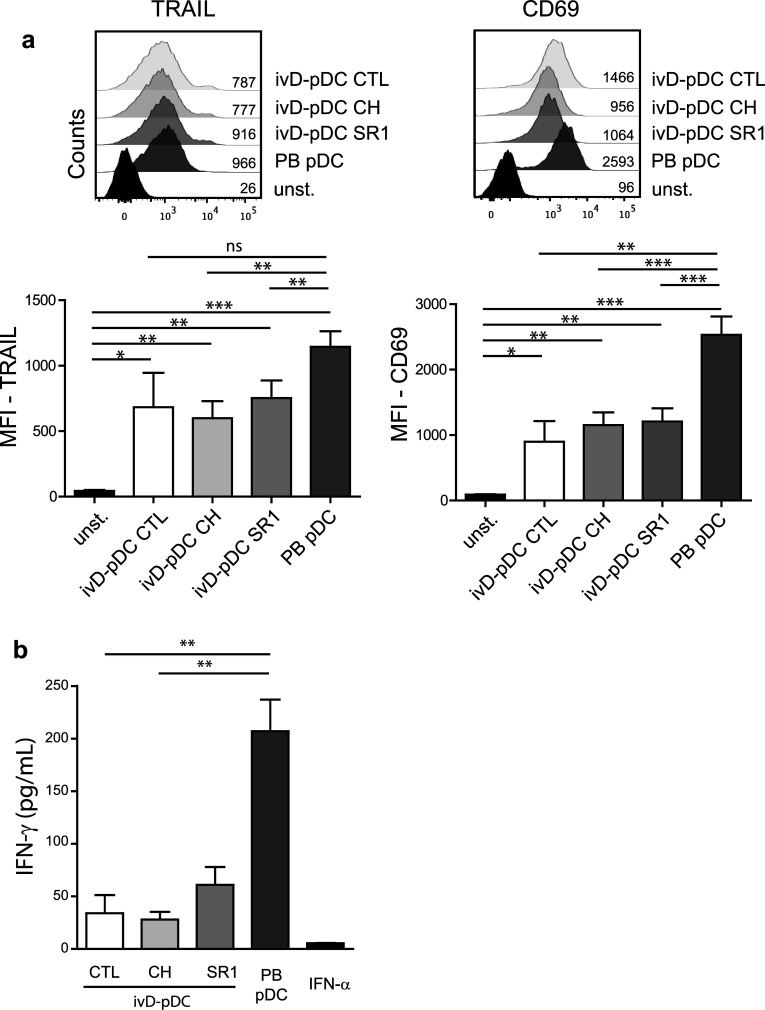
Fig. 3.
Phenotypic changes of pDC-stimulated NK cells. a Phenotypic analysis of activated NK cells was performed by immunostaining (TRAIL and CD69) and flow cytometry analysis (gated on CD56+CD3− cells). Representative histograms are presented with mean of fluorescence (MFI) for TRAIL (left panel) and CD69 (right panel). Bar graphs represent the average MFI for TRAIL and CD69 with SD (n = 3–7 experiments). b IFN-γ production by unstimulated NK cells (CTL—control) or pDC-stimulated NK cells was measured by ELISA in culture supernatants. Averages of 6 independent experiments are presented with SD. Statistical analyses were performed by using one-way analysis of variance. *p < 0.05, **p < 0.01, ***p < 0.001

