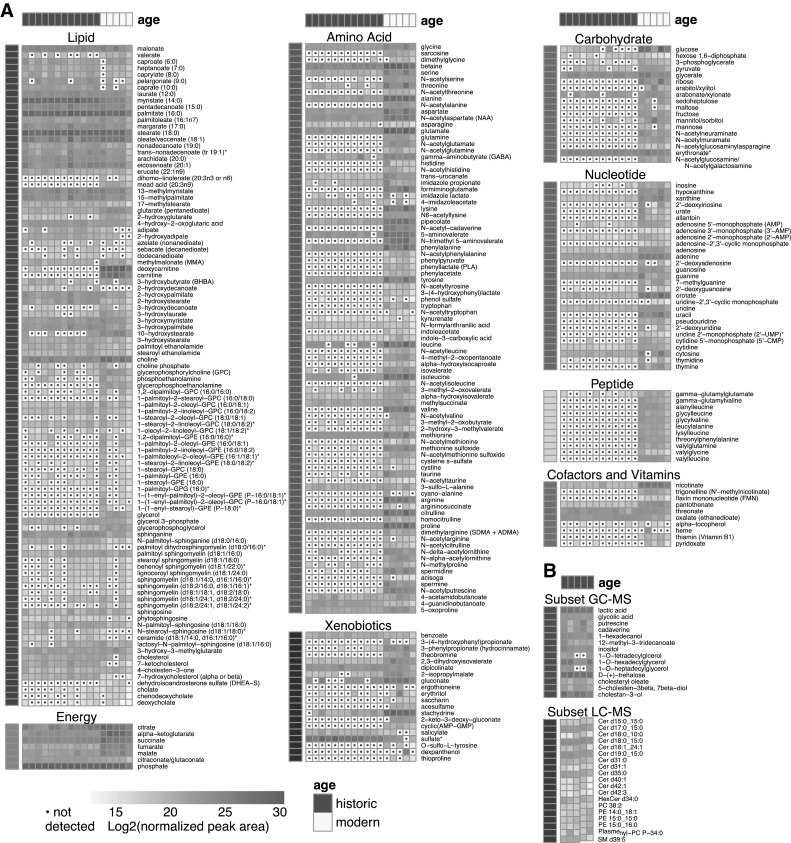
Fig. 1.

Heat map summary of metabolites observed in modern and historic dental. Metabolites were quantified by area under the curve and normalized to mass of sample extracted. a UPLC–MS/MS-detected metabolites. Samples were hierarchically clustered, and log2 transformed values are presented above, grouped by super-pathway. b Metabolites detected by GC–MS and LC–MS in historic calculus. Non-filled cells containing a dot indicate the compound was not detected
