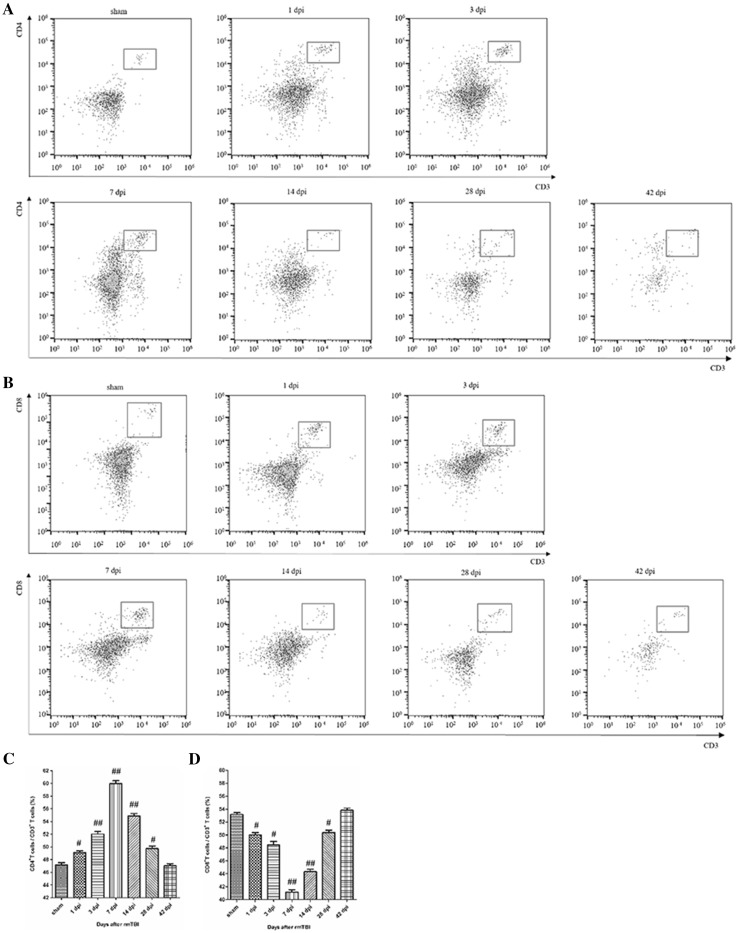
Fig. 2.
Analysis of T cell subsets in the injured brain after rmTBI. a Representative flow cytometry data for CD4+ T cells (CD3+ CD4+ cells) in the injured brain at the indicated days after rmTBI. b Representative flow cytometry data for CD8+ T cells (CD3+ CD8+ cells) in the injured brain at the indicated days after rmTBI. c Graph illustrating quantitative data for the percentages of CD4+ T cells in the brain at the indicated days after rmTBI. d Graph illustrating quantitative data for the percentages of CD8+ T cells in the brain at the indicated days after rmTBI. n = 6 for each experiment. CD4+ T cells: ##p < 0.01 at 3, 7, and 14 dpi compared with sham; #p < 0.05 at 1 and 28 dpi compared with sham. CD8+ T cells: ##p < 0.01 at 7 and 14 dpi compared with sham; #p < 0.05 at 1, 3, and 28 dpi compared with sham

