Fig. 3.

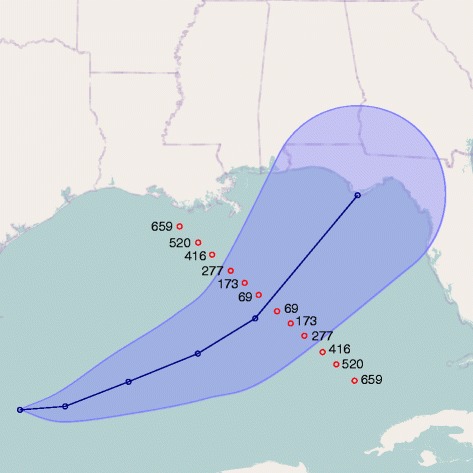
An example of the cone visualization, shown with the 12 possible oil rig locations. Only one location was presented on each trial (and km were not presented)

An example of the cone visualization, shown with the 12 possible oil rig locations. Only one location was presented on each trial (and km were not presented)