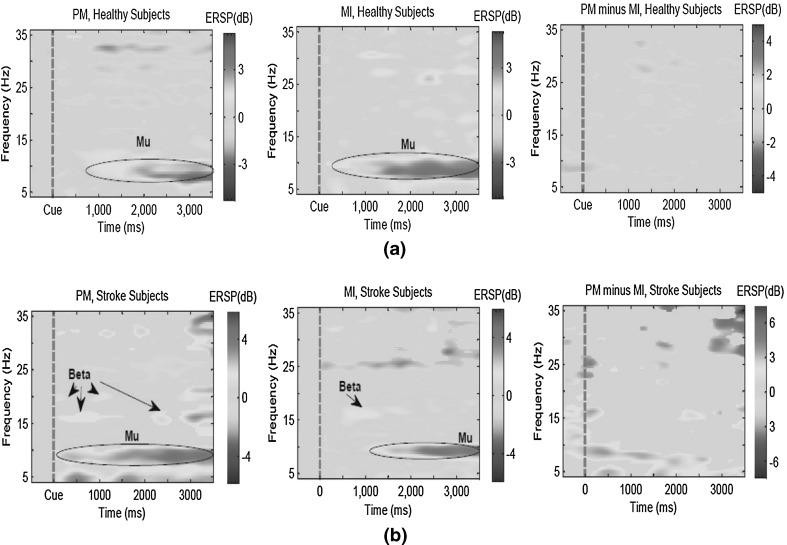
Fig. 5.
The event-related spectral perturbation (ERSP) images for the passive movement (PM), motor imagery (MI) and their differences, for a the 16 healthy and b six stroke subjects. The ERSP images were plotted at the corresponding activated motor regions (ie. channels C3 and C4 for right and left hand tasks, respectively). The dashed lines denote the cue time. In MI and PM ERSP images, the non-green pixels indicate the areas that the power spectrum is significantly different from the pre-cue baseline. In PM minus MI ERSP images, thenon-green pixels indicate the areas that the power spectrum between PM and MI is significantly different (). a Healthy subjects. b Stroke patients

