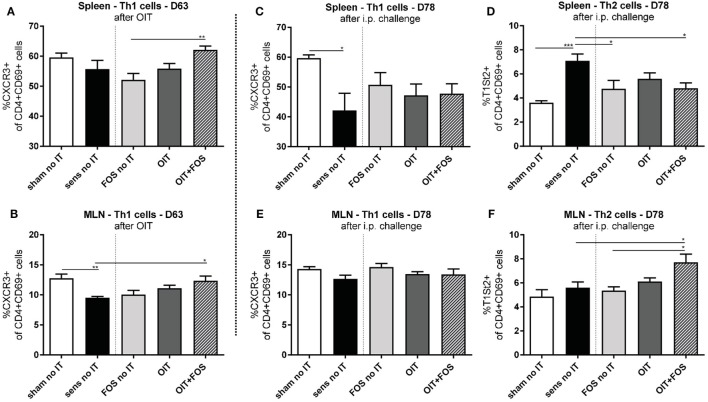
Figure 4.
Flow cytometric analysis of T helper cell populations in spleen and MLN. (A) Percentage of activated Th1 cells (CXCR3+ of CD4+ CD69+ cells) in spleen and (B) in MLN after immunotherapy (D63). (C) Percentage of activated Th1 cells and (D) Th2 cells (T1St2+ of CD4+ CD69+ cells) in spleen after i.p. challenge (D78). (E) Percentage of activated Th1 cells and (F) Th2 cells in MLN after i.p. challenge (D78). Data are represented as mean ± SEM n = 5–6/group in (A–F). Statistical analysis was performed using one-way ANOVA and Bonferroni’s post hoc test. *p < 0.05, **p < 0.01, ***p < 0.001, ****p < 0.0001. Sens, sensitization; OIT, oral immunotherapy; FOS, fructo-oligosaccharides; no IT, no immunotherapy; i.p., intraperitoneal; Th, T helper; MLN, mesenteric lymph nodes.

