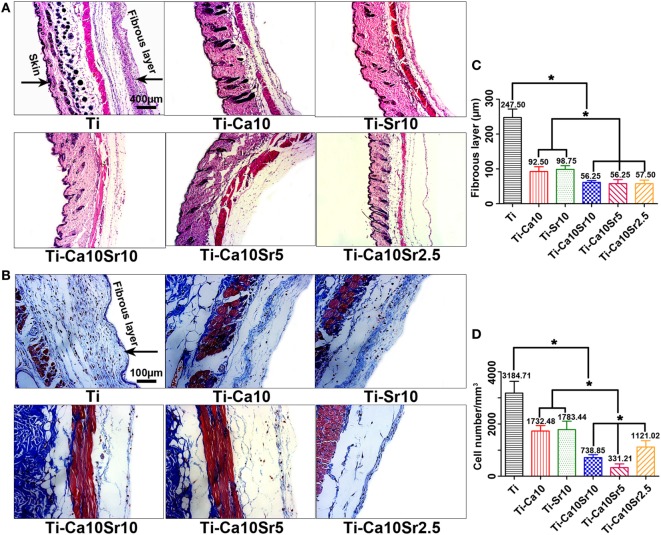
Figure 9.
Images of hematoxylin eosin (HE) staining and Masson’s trichrome staining on the air-pouch tissues adjacent to different samples at day 7 of implantation. (A) HE stained images showing a whole structure and layers of the air-pouch tissues. Scale bar, 400 µm. (B) Masson’s trichrome stained images obviously displaying the fibrous tissues and the infiltration cells. Scale bar, 100 µm. (C) Thickness of fibrous layer. (D) Numbers of infiltration cells. *p < 0.05.

