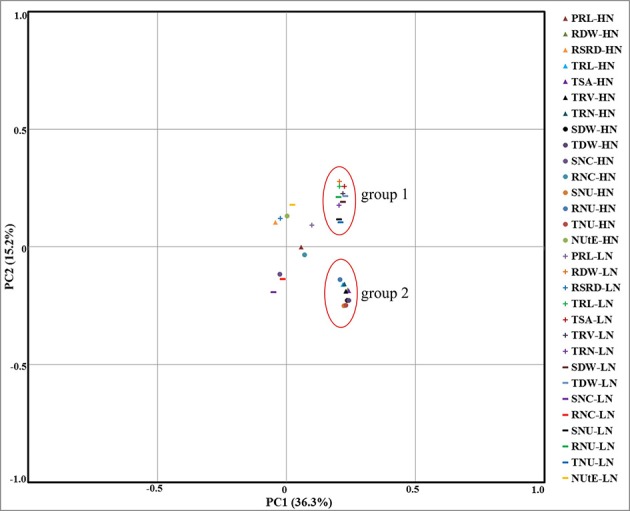
Figure 1.

PCA of the RIL population for RM- and NUE-related traits evaluated in hydroponics under the conditions of HN (triangle and circle respectively) and LN (cross and horizontal line respectively) levels. Thirty traits were projected onto the first and second principal components. Two obvious groups indicated by red circles: group1 or group2 included all of the RM- and NUE-related traits (except PRL, RSRD, RNC, SNC, and NUtE) under LN or HN conditions, respectively. The traits had the greatest positive influence over the determination of PC1 (>0.2) were all located in the two groups. Group1 had positive influence over the determination of PC2 while group2 had negative influence. Traits in each group were all closely related and combined into two clusters distributed in two different N levels, respectively.
