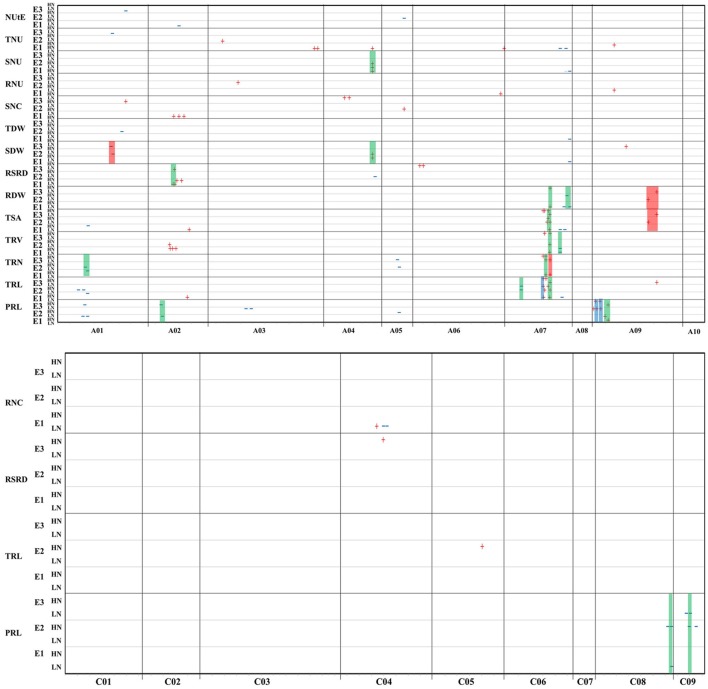
Figure 2.
Genomic regions of 129 QTLs detected for RM-related traits and NUE-related traits across three independent hydroponics experiments (E1-E3) under HN and LN levels. For each QTL symbol, red sign (+) or blue sign (–), represents positive additive effect from ZS11 or No. 73290 alleles respectively and the horizontal ordinate indicate the peak position. The rectangles represent the sQTL: red for LN-specific sQTL, blue for HN-specific sQTL and green for constitutive sQTL.

