
FIGURE 2.
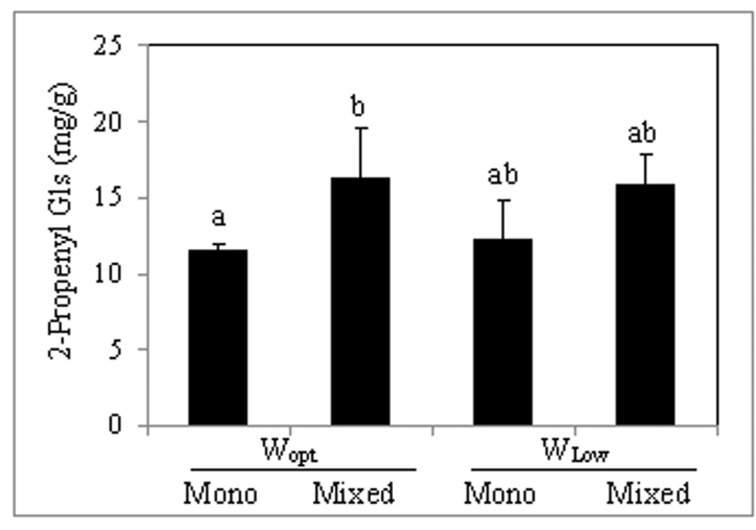
2-Propenyl glucosinolate concentration in B. carinata leaves (mg/g dry weight). For treatment description, see Table 1. Shown are the mean values (n = 4) obtained for each treatment + standard deviation. Bars followed by the same letter are not significantly different (Tukey HSD test; P ≤ 0.05).