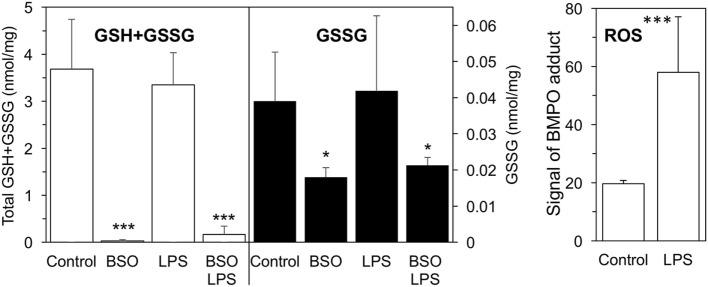
Figure 1.
GSH + GSSG levels and ROS production in LPS-treated cells with or without BSO. Cells were pretreated with 120 µM BSO for 24 h, followed by 10 ng/ml LPS for 2 h. Total GSH + GSSG and GSSG levels measured in the cell lysates are the mean ± SD of six biological replicates from three independent experiments and are expressed as nmoles/mg protein. ROS production is expressed as signal of BMPO adduct, mean ± SD of six biological replicates from six independent experiments *P < 0.05 and ***P < 0.001 vs control by two-tailed Student’s t-test. BMPO, 5-tert-butoxycarbonyl-5-methyl-1-pyrroline N-oxide; BSO, buthionine sulfoximine; GSH, glutathione; GSSG, glutathione disulfide; LPS, lipopolysaccharide; ROS, reactive oxygen species.

