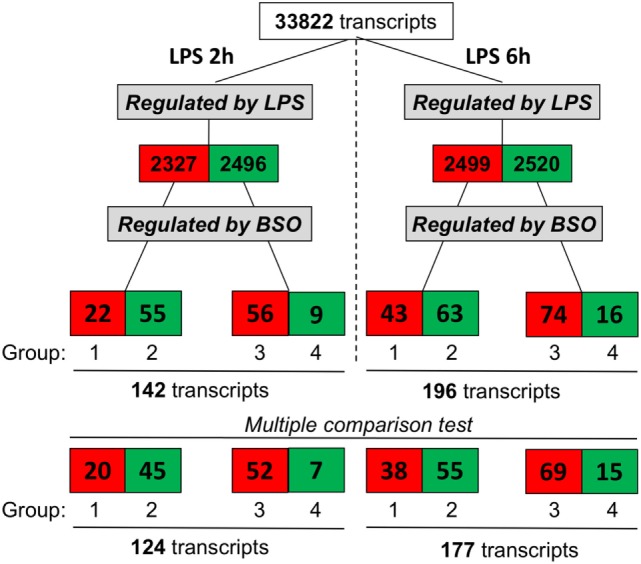
Figure 2.

Effect of GSH depletion on LPS-induced changes in gene expression profile. The dataset was filtered to select transcripts that were affected by LPS (LPS vs control, first step), then by BSO (BSO + LPS vs LPS alone, second step). Cutoff for selection was 1.5-fold change and P < 0.05, using the Student’s t-test. Significantly different expressed genes were further selected by using one-way ANOVA, followed by a correction for multiple comparisons by controlling the false discovery rate with the two-stage step-up method of Benjamini, Krieger, and Yekutieli. The number of transcripts resulting from filtering is indicated and color coded (red, increased; green, decreased). ANOVA, analysis of variance; BSO, buthionine sulfoximine; GSH, glutathione; LPS, lipopolysaccharide.
