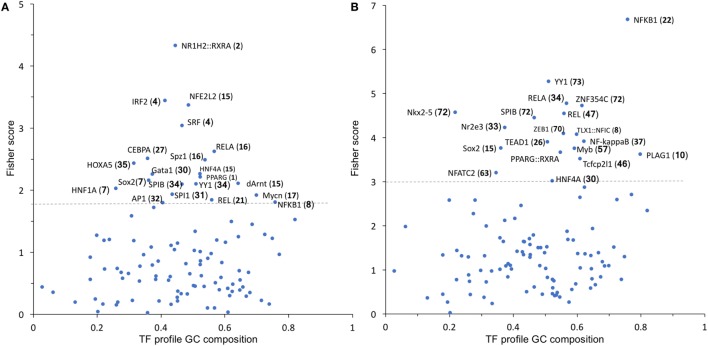
Figure 5.
TF binding profile overrepresented in Group 1 (A) and Group 2 (B) transcripts, showing the Fisher score plotted against GC composition (1 = 100%). The threshold (dashed line) is set to the mean + 1 SD. The number in parentheses indicates the number of transcripts that map to each TF. TF, transcription factor.

