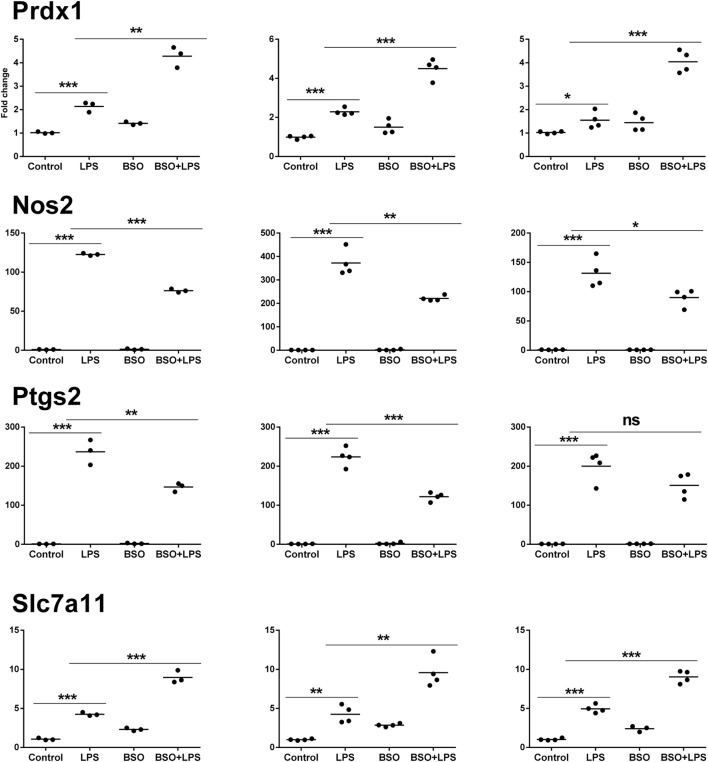
Figure 7.
PCR validation of the microarray data at 6 h. Results for four genes (Prdx1, Nos2, Ptgs2, Slc7a11), comparing expression data from microarrays (N = 3 biological replicates; left graphs) with results from PCR analysis using all the four replicates of the RNA from the same experiment (N = 4 biological replicates; middle graphs) and RNA from an independent experiment (N = 4 biological replicates; right graphs). Data are expressed as fold change vs one of the respective control samples. For each experimental group, the mean is also shown. *P < 0.05, **P < 0.01, and ***P < 0.001 by two-tailed Student’s t-test. PCR, polymerase chain reaction.

