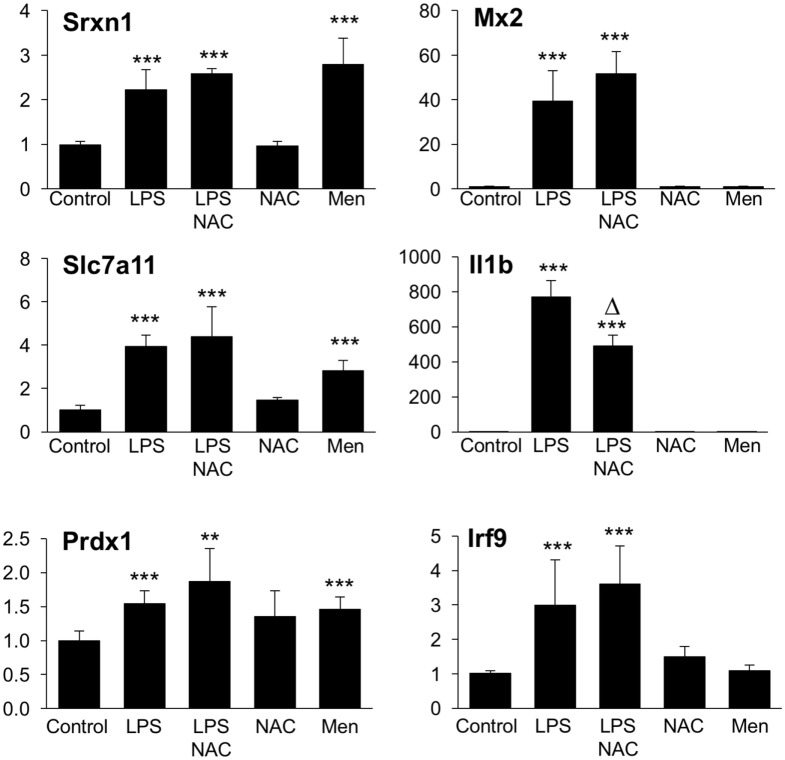
Figure 9.
Effect of NAC and menadione on Group 1 (left) and Group 2 (right) genes. Cells were treated with 5 mM NAC for 1 h and then stimulated with 10 ng/ml LPS for further 2 h. Menadione (Men) was added at 10 µM for 2 h. Gene expression was measured by qPCR. Data are expressed as fold change vs one of the control samples, and are the mean ± SD of six biological replicates from two independent experiments. **P < 0.01 and ***P < 0.001 vs control; Δ P < 0.01 vs LPS by two-tailed Student’s t-test. LPS, lipopolysaccharide; NAC, N-acetyl-l-cysteine; qPCR, quantitative polymerase chain reaction.

