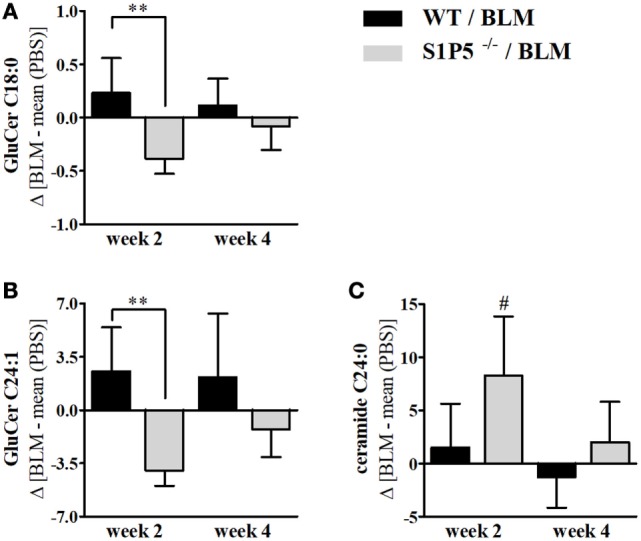
Figure 5.

Long-chain ceramides, showing a decrease in S1P5−/− following BLM treatment. BLM-induced regulation of GluCer C18:0 (A), GluCer C24:1 (B), and ceramide C24:0 (C) in the skin of WT (black bars) and S1P5−/− mice (gray bars). Lipid measurements were performed after extraction by LC-MS/MS analysis (ng/mg) and presented here for BLM-treated mouse groups as difference to the mean of respective PBS controls. Data are shown as mean ± SD of n = 4–5 mice/group with # indicating p ≤ 0.05, ** for p ≤ 0.01. Hashtags (#) characterize significance in comparison to the respective PBS controls. Statistical analysis was performed using a one-way ANOVA with Bonferroni’s multiple comparison test. (Δ = difference). ANOVA, analysis of variance; BLM, bleomycin; GluCer, glucosylceramide; LC-MS/MS, liquid chromatography coupled to tandem mass spectrometry; PBS, phosphate-buffered saline; WT, wild type.
