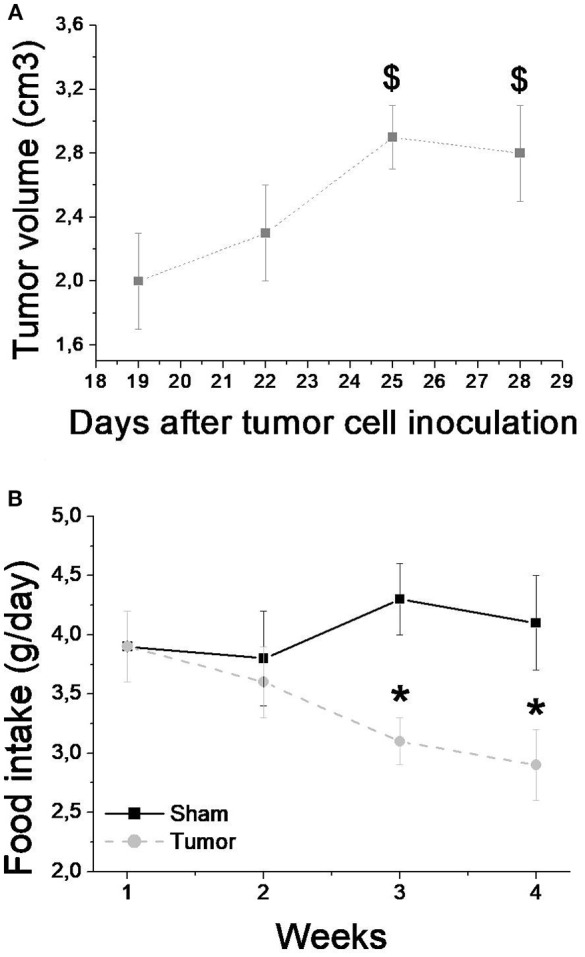
Figure 1.

Tumor volume (A) and food intake (B) over the 4 weeks after tumor cell inoculation for sham (n = 8) and tumor (n = 8) groups. Values are mean ± SD. *Indicates significant difference from S group; $Indicate significant difference from week 1 (P < 0.05 by ANOVA 2-way for two independent samples).
