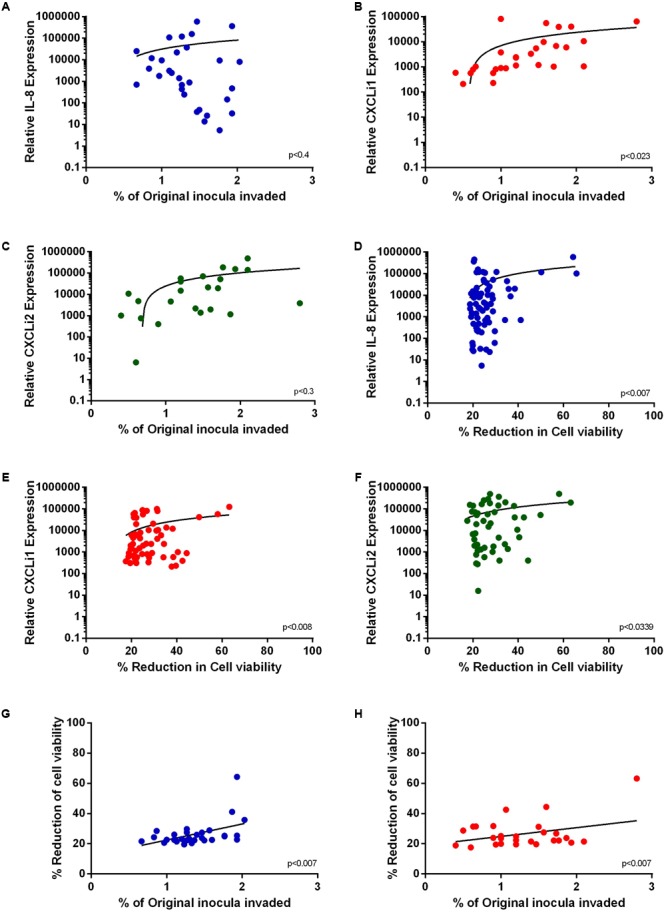
FIGURE 5.

Relationships between C. jejuni-induced cellular invasion, toxicity and cytokine production. Phenotypic data was subjected to regression analysis. (A) IL-8 (B) CXCLi1 and (C) CXCLi2 correlations with C. jejuni invasion. (D) IL-8, (E) CXCLi1, (F) CXCLi2 correlations with toxicity. (G) HT29 cell viability correlation with invasion (H) 8E11 cell viability correlation with invasion.
