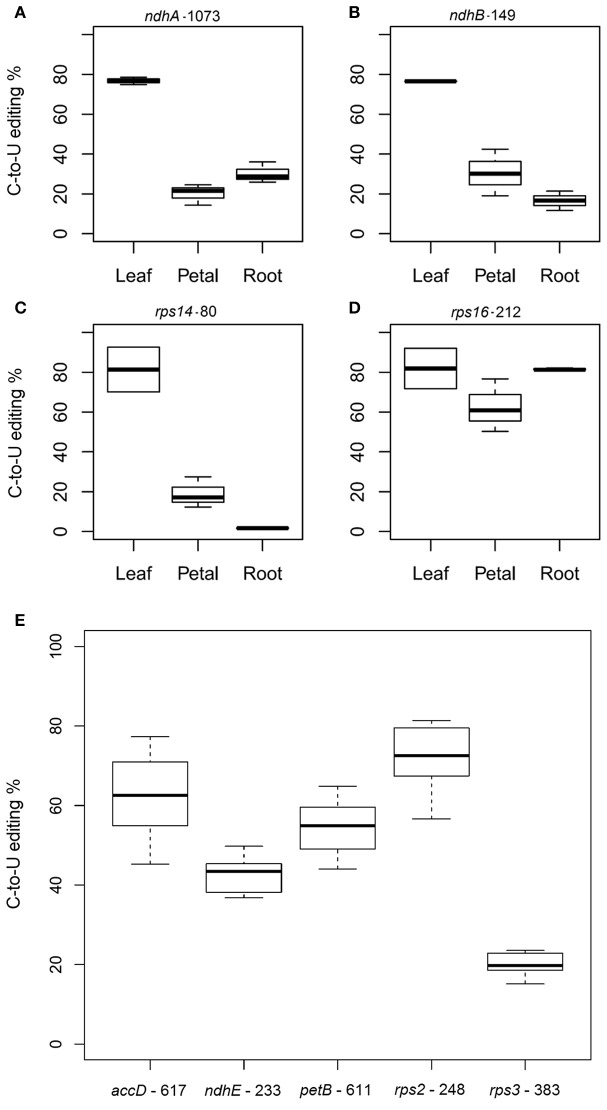
Figure 5.
Confirmation and quantitation of soybean editing sites predicted by PREP. (A) ndhA-1053, (B) ndhB-149, (C) rps14-80, and (D) rps16-212 were analyzed in leaves, petals and roots. Box area represents the lower and upper percentiles; (E) confirmation and quantitation of soybean editing sites identified by SNP analysis. Transcripts from soybean leaves were analyzed for C-to-U editing in specific nucleotide positions: accD-617, ndhE-233, petB-611, rps2-248, and rps3-383. Box area represents the lower and upper percentiles. The upper whisker of the boxplot indicates the highest editing value observed; the lower whisker, the lowest editing value; and the middle line, the median.

