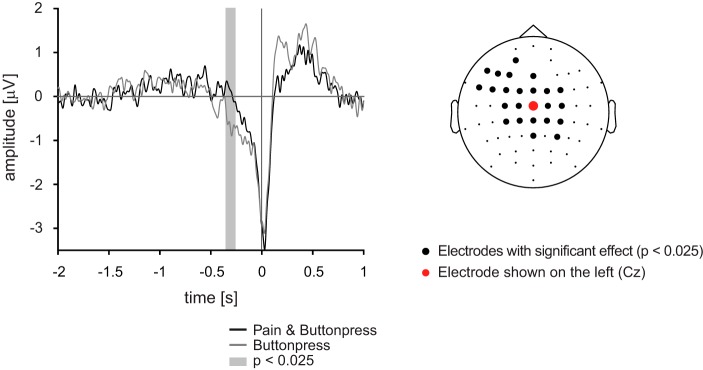
Fig. 2.
Time domain results of the main experiment. Left: grand averages of movement-related potentials at electrode Cz. Statistical comparison between Pain & Buttonpress and Buttonpress conditions were performed during the last 2 s of motor preparation, and the gray shaded time window highlights significantly different time periods. Right: electrodes where significant differences were observed are marked by bold black dots. Statistical analyses were performed with cluster-based permutation statistics.

