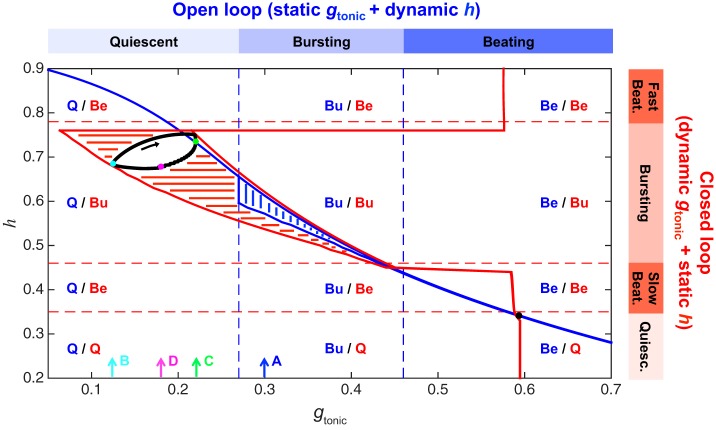
Fig. 3.
Closed-loop bursting exists in the quiescent regime of the isolated CPG system. Blue contour and vertical hatching indicate the range of values the dynamic variable h (x-axis) traverses as the static parameter gtonic (x-axis) is varied in the open-loop model. For example, with gtonic fixed at 0.3 nS, the CPG is bursting and h oscillates between 0.57 and 0.61. Blue dashed vertical lines demarcate regions of quiescence (Q), bursting (Bu), and beating (Be) in the open-loop model. Red contour and horizontal hatching indicate the range of values the variable gtonic traverses as the parameter h is varied in the version of the closed-loop model with dynamic gtonic and static h. For example, with h fixed at 0.6, the CPG is bursting and gtonic oscillates between 0.21 and 0.32 nS. Red dashed horizontal lines demarcate regions of quiescence, slow beating, bursting, and fast beating in this model. Black curve is the bursting trajectory of the full closed-loop model (with dynamic gtonic and dynamic h) projected onto the gtonic-h plane. Note that this limit cycle exists in the Q/Bu region, indicating that the gtonic values traversed during closed-loop bursting lie entirely within the range of gtonic values that produce quiescence in the open-loop model. Black arrow indicates the direction of flow on the closed-loop limit cycle. Cyan, green, and magenta dots (along with cyan, green, and magenta arrows labeled B, C, and D on the gtonic axis) denote 3 locations on the closed-loop limit cycle that are further illustrated in Fig. 4, B–D (where the same color scheme is used). Blue arrow labeled A corresponds to gtonic = 0.3 nS, which is the value used to further illustrate the open-loop limit cycle in Fig. 4A.

