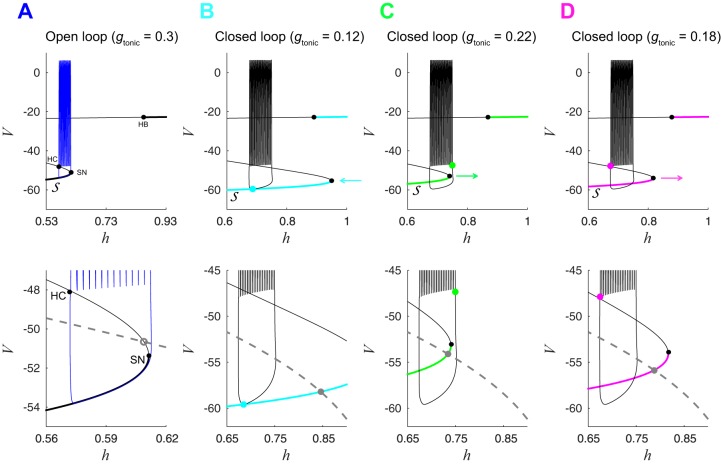
Fig. 4.
Closed-loop fast subsystem undergoes bifurcations differently than the open-loop fast subsystem. A, top: bifurcation diagram of open-loop fast subsystem with bifurcation parameter h and gtonic = 0.3 nS. Black curve shows stable (thick lines) and unstable (thin lines) fixed points of the fast subsystem. Solid black dots indicate saddle-node (SN), Hopf (HB), and homoclinic (HC) bifurcations of the fast subsystem. Blue trace is the bursting trajectory from the open-loop system projected onto the h-V plane. Bottom: zoomed-in view of image at top, also showing the h-nullcline (dashed gray line). Open gray dot is an unstable fixed point of the full CPG subsystem ; the bursting trajectory circumnavigates this unstable fixed point. Additional unstable fixed points located at (h = 0.20, V = −39) and (h = 0.02, V = −24) are not shown. B–D, top: bifurcation diagrams of closed-loop fast subsystem during silent phase (B), at the onset of spiking (C), and at the termination of spiking (D). Black trace is the closed-loop bursting trajectory, and gray curves show how shifts as gtonic varies during closed-loop bursting (the locations shown correspond to the points labeled B–D in Fig. 3). B: cyan dot shows the location of the trajectory at the minimum gtonic value (0.12 nS) observed during closed-loop bursting. Lower portion of and corresponding SN point are shifted to the right relative to the open-loop system, and the CPG is not spiking. Cyan arrow indicates that will move to the left as the trajectory evolves and gtonic increases through the remainder of the silent phase of the burst. C: green dot shows the location of trajectory at the maximum gtonic value (0.22 nS) observed during closed-loop bursting. Lower portion of and SN point are shifted to the left relative to B, and the CPG is about to start spiking. Green arrow indicates that will move to the right as the trajectory evolves and gtonic decreases, during the spiking phase of the burst. D: magenta dot shows the location of the trajectory at gtonic = 0.22, which is near the HC bifurcation that terminates spiking. Lower portion of is shifted to the left relative to B and to the right relative to C. Magenta arrow indicates that will continue to move to the right until reaching the minimum gtonic configuration shown in B. B–D, bottom: solid gray dots are stable fixed points of the full CPG subsystem . The trajectory does not circumnavigate these fixed points but exhibits bursting due to the movement of , the fast subsystem’s steady-state curve.

