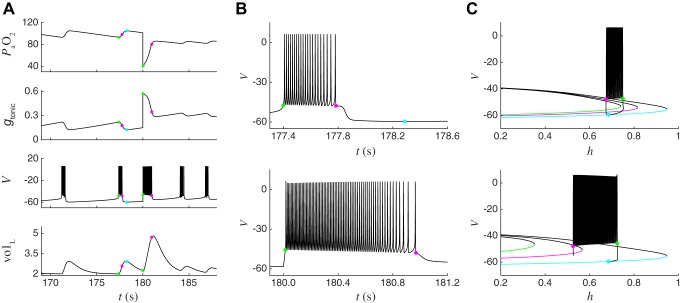
Fig. 10.
Hypoxia-induced barrage of spiking leads to an autoresuscitative lung expansion and is explained by the effect of hypoxia on the location of the homoclinic bifurcation that terminates spiking. A: traces from the closed-loop model during eupneic bursting (t < 180 s) and after a hypoxic perturbation (t > 180 s). At t = 180 s, (top) was set to 40 mmHg, which causes a large and immediate increase in gtonic (2nd from top). The increase in gtonic elicits a barrage of spiking (V, 3rd from top) that drives a much bigger increase in lung volume (volL, bottom) than occurs during a typical breath. This large breath causes a substantial increase in , which reduces gtonic sufficiently for the system to recover from the perturbation and return to eupneic bursting. Green and magenta dots indicate the values of system variables at initiation and termination of spiking during the last burst before the perturbation and the first burst after the perturbation, respectively. Cyan dot indicates the minimum gtonic point during eupneic closed-loop bursting. B: expanded view of voltage trace from A during the last burst before the hypoxic perturbation (top) and during the barrage of spiking induced by the perturbation (bottom). The burst induced by the perturbation is longer and consists of higher-frequency spiking than the burst before the perturbation. C: bifurcation diagram of BRS model fast subsystem during the last burst before the hypoxic perturbation (top) and during the barrage of spiking induced by the perturbation (bottom). Top: black trace is the trajectory during closed-loop bursting, projected onto the V-h plane. Green, magenta, and cyan curves show the location of the fast subsystem steady states in its leftmost position, which occurs at the initiation of spiking (green, gtonic = 0.22 nS), at the homoclinic bifurcation that terminates spiking (magenta, gtonic = 0.18 nS), and at its rightmost position, which occurs at the gtonic minimum point (cyan, gtonic = 0.12 nS). Note that these 3 curves are the same as those shown in Fig. 4, B–D. Bottom: black trace is the trajectory during the barrage of spiking induced by the perturbation, projected onto the V-h plane. Green and magenta curves show the location of the fast subsystem steady states in its leftmost position, which occurs at the initiation of spiking (green, gtonic = 0.57 nS), and at the homoclinic bifurcation that terminates spiking (magenta, gtonic = 0.35 nS). Cyan curve is the same as at top. The drastic reduction in due to the hypoxic perturbation has shifted the green curve much further to the left (cf. top and bottom), enabling the CPG to fire more spikes (and at a higher frequency) before reaching the homoclinic bifurcation.

