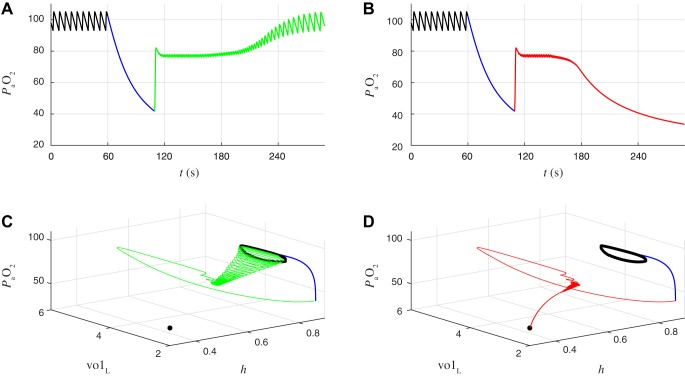
Fig. 12.
Recovery to eupnea vs. tachypneic failure after transient interruption of chemosensory feedback. A: time course of before (black), during (blue), and after (green) interruption of chemosensory feedback. Black, eupneic breathing in closed-loop model; blue, chemosensory feedback is interrupted by holding gtonic fixed at 0.1 nS for 49.2466 s; green, chemosensory feedback is reestablished by again making gtonic a function of . System recovers to eupnea. B: same as A, except the gtonic = 0.1 nS clamp (blue) is held for 0.1 ms longer. After reestablishing chemosensory feedback the system ultimately descends into tachypnea (red) rather than recovering to eupnea. C: eupneic recovery from A projected onto (h, volL, ) coordinates. During the gtonic clamp (blue curve), the CPG is quiescent and decreases to 42 mmHg. After release of the clamp (green curve), gtonic increases rapidly, causing a barrage of spiking and a large expansion of lung volume that rapidly increases to 82 mmHg. From t = 120 to 180 s the system exhibits bursts of spiking with shorter interburst intervals and shorter burst durations than eupneic breathing. This leads to intermediate values (76–80 mmHg) as the interburst intervals and burst durations gradually lengthen and the system returns to eupneic breathing. D: tachypneic failure from B projected onto (h, volL, ) coordinates. Same as C, except that during the intermediate oscillations from t = 120 to 180 s the interburst intervals and burst durations gradually shorten and the system descends into tachypnea (red curve).

