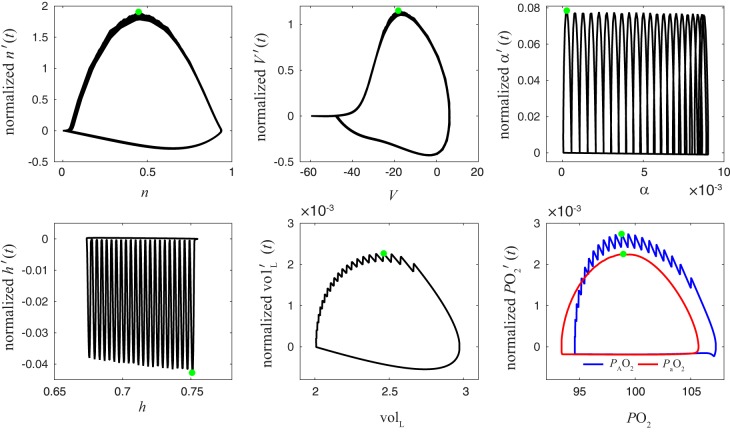
Fig. 16.
Phase plots showing the relative speed of each variable during closed-loop bursting identify as a slow variable. x-Axis is x and vertical y-axis is the rate of change x′(t) normalized by the range of x, where x = n, V, α, h, volL, , . Green dots indicate the maximal speed vx of each variable (−vx is shown for x = h). Note the significantly different timescales involved: , , and volL are slower than h and α, which themselves are slower than V and n.

