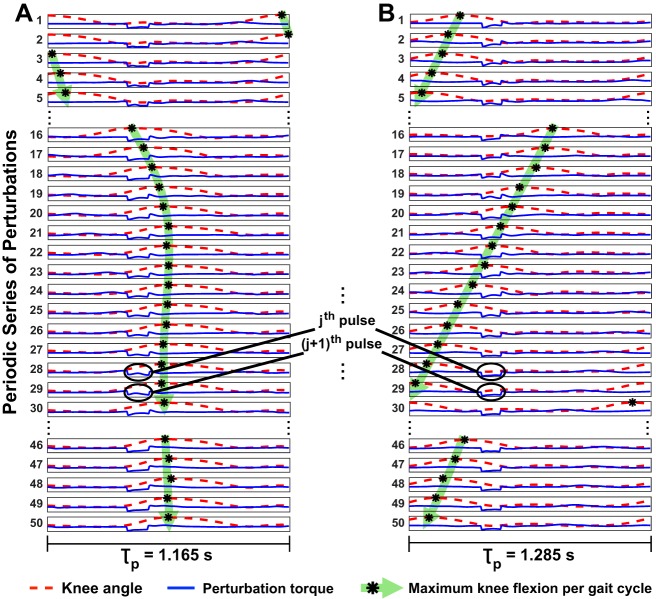
Fig. 4.
Phase relation between maximum knee flexion per gait cycle and torque pulses along the periodic series of perturbations. Each row represents one perturbation cycle with its period indicated at the bottom and the torque profile depicted in blue. The knee angle profile (dashed line, red curve) during each perturbation cycle is shown in each row with the maximum knee flexion landmark identified. A: representative gait that entrained to shorter τp; the maximum knee flexion converged to a specific phase of the perturbation cycle (highlighted in green). B: representative gait that did not entrain to the longer τp; the maximum knee flexion drifted continuously relative to the torque pulse (highlighted in green).

