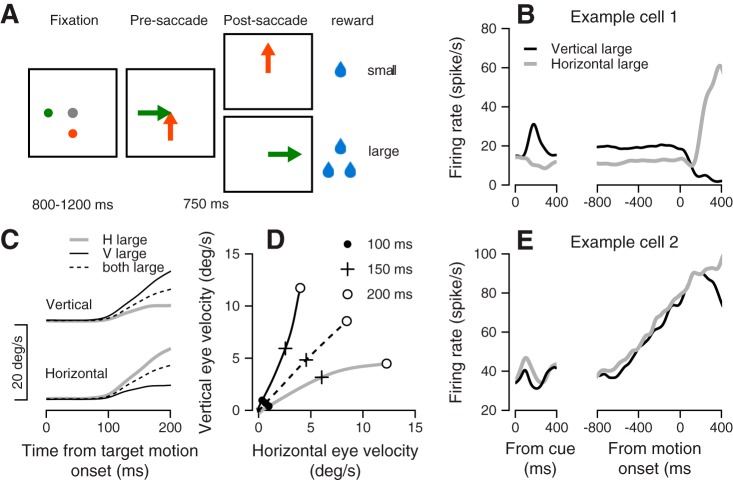
Fig. 1.
Target selection task, behavior, and example for neural responses. A: sequence of snapshots illustrates the structure of the behavioral task with two targets. B: average firing rate responses from example cell 1. C: average across all sessions of the vertical (top) and horizontal (bottom) eye velocity. D: data from C were replotted to show the trajectory of the eye velocity traces. Traces plot the average horizontal vs. vertical eye velocity in the first 200 ms after the onset of target motion. The solid circles (●), plus signs (+), and open circles (○) show the data at 100, 150 and 200 ms, respectively, after target motion onset. The gray, black, and dashed traces in C and D show the data from trials where the large reward was vertical, horizontal, or on both axes. E: average firing rate responses from example cell 2. The lines show the response in interleaved selection conditions in which the large reward was either horizontal (gray) or vertical (black). Left and right plots show activity aligned to onset of color cue and onset of target motion.

