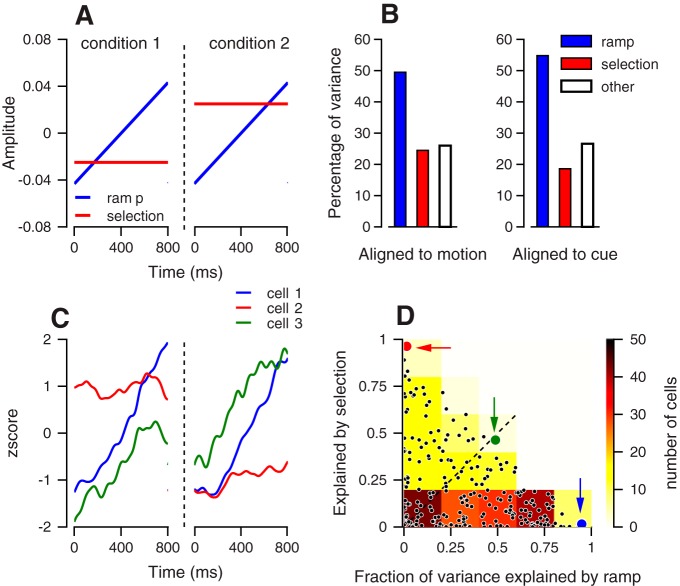
Fig. 3.
Decomposing neural activity into selection and ramping. A: basis functions for extracting selection-related and ramping activity. The response from the selection conditions was concatenated, and the dashed vertical line differentiates selection conditions. B: percentage of the variance explained by projection on the ramping (blue), selection basis functions (red), and the residual variance that cannot be explained by ramping or selection base function (white). Data were aligned to target motion onset (left) or to color cue onset (right). When aligned to cue, we excluded the time of the transient visual response (0–350 ms) and analyzed activity in the following 800 ms C: z-scores of the responses of three neurons in the last 800 ms before target motion onset. Different colors correspond to the different neurons, and the dashed vertical line differentiates selection conditions. D: fraction of the variance explained by the projection of the neuron activity on the ramp (horizontal) and selection (vertical) basis functions. Each dot shows the data from a single neuron. The red, green and blue dots correspond to the neurons in C. The background colors show the distribution of the dots binned in squares of 0.2 × 0.2, where the number of neurons in the squares determines their color. Data from all of the neurons in the data set (n = 232) were used for constructing the figure.

